By New Deal democrat Variations on the Phillips Curve: unemployment and underemployment This is part of a longer post I wanted to write, and if FRED didn’t play so poorly with iPad I would put it all up. But, having finished with my cursing, let me put up a truncated version now and follow up with another one sometime in the next week. This picks up on my post from several days ago in which I noted that a fuller explanation of the cycle of wage gains should take into account the labor force participation rate for prime age workers. So I thought I would show the differences in how the Phillips Curve (the tradeoff between wages and unemployment) looks depending on how completely we look at it. Let’s start with the unemployment rate (bottom scale) vs. YoY nonsupervisory wage growth (left scale) since the series started in the 1960s: It’s pretty clear that there are two regimes, higher vs. lower wage growth (top vs. bottom). And if you were looking for a clean relationship in which lower inflation equals higher wage growth, it ain’t there. But let’s cull out the two big recessions and recoveries 1981-89 and 2007-17. Here’s the 1980s: and here’s the last 10 years: In each case, once unemployment gets low enough, increased wage growth does kick in.
Topics:
Dan Crawford considers the following as important: Taxes/regulation, US/Global Economics
This could be interesting, too:
Joel Eissenberg writes How Tesla makes money
Angry Bear writes True pricing: effects on competition
Angry Bear writes The paradox of economic competition
Angry Bear writes USMAC Exempts Certain Items Coming out of Mexico and Canada
by New Deal democrat
Variations on the Phillips Curve: unemployment and underemployment
This is part of a longer post I wanted to write, and if FRED didn’t play so poorly with iPad I would put it all up. But, having finished with my cursing, let me put up a truncated version now and follow up with another one sometime in the next week.
This picks up on my post from several days ago in which I noted that a fuller explanation of the cycle of wage gains should take into account the labor force participation rate for prime age workers. So I thought I would show the differences in how the Phillips Curve (the tradeoff between wages and unemployment) looks depending on how completely we look at it.
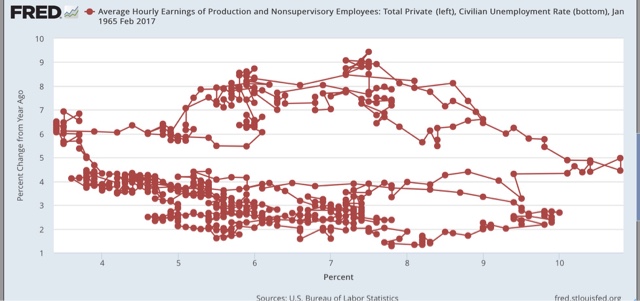
Let’s start with the unemployment rate (bottom scale) vs. YoY nonsupervisory wage growth (left scale) since the series started in the 1960s:

It’s pretty clear that there are two regimes, higher vs. lower wage growth (top vs. bottom). And if you were looking for a clean relationship in which lower inflation equals higher wage growth, it ain’t there.
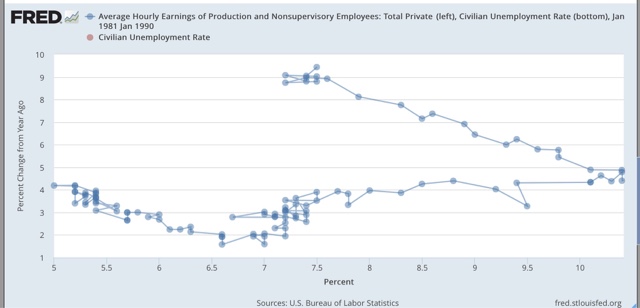
But let’s cull out the two big recessions and recoveries 1981-89 and 2007-17. Here’s the 1980s:
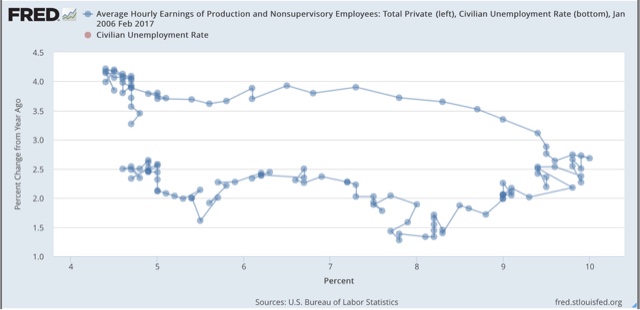
and here’s the last 10 years:
In each case, once unemployment gets low enough, increased wage growth does kick in. But before that, we see wage growth falling as unemployment increases during the recession — and continuing to decrease in the earlier part of the recovery thereafter while unemployment remains relatively high (over 7% or so).
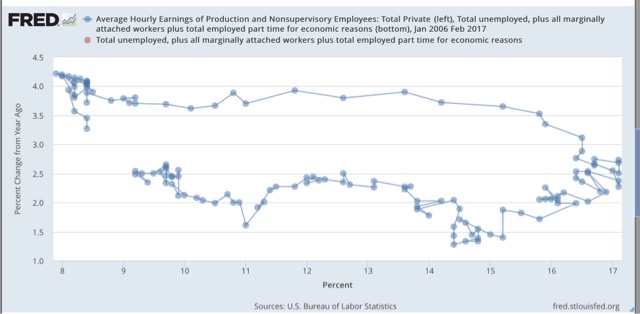
Here’s the same scatterplot for the U6 underemployment rate:
The traditional Phillips Curve gained prominence during the post-WW2 era when unemployment remained relatively low for nearly 30 years. Now we can see that it is only part of the story. It only holds true when the unemployment and underemployment rates are low enough. At higher un(-der)employment rates, whether going into or coming out of recessions, wage growth decelerates even if unemployment or underemployment are decreasing.
crossposted with Bonddad blog


