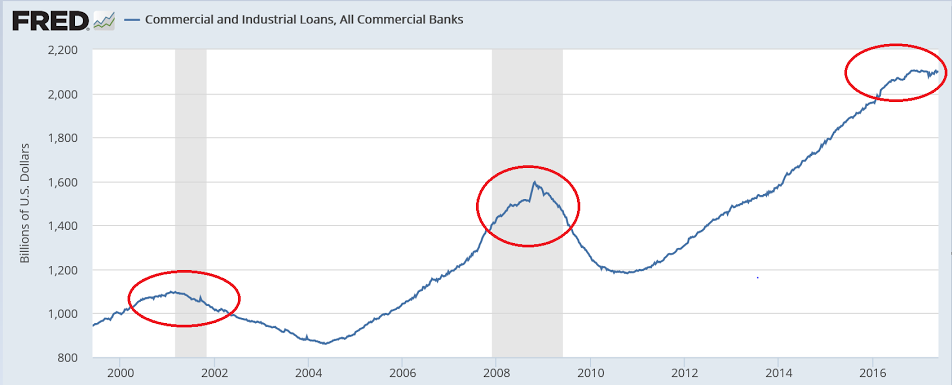
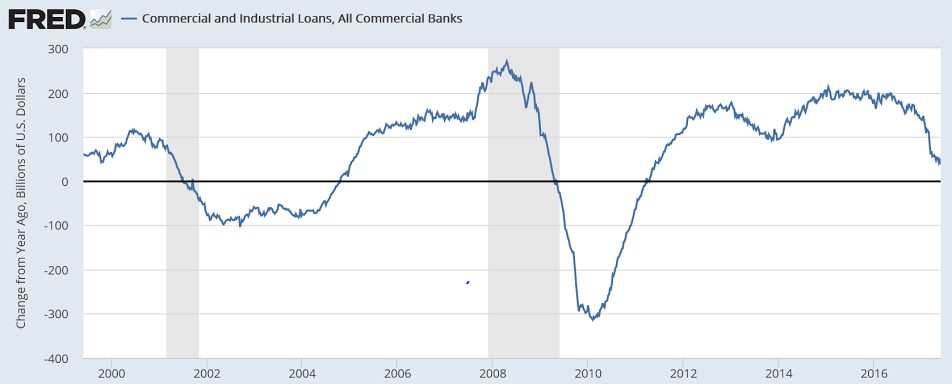
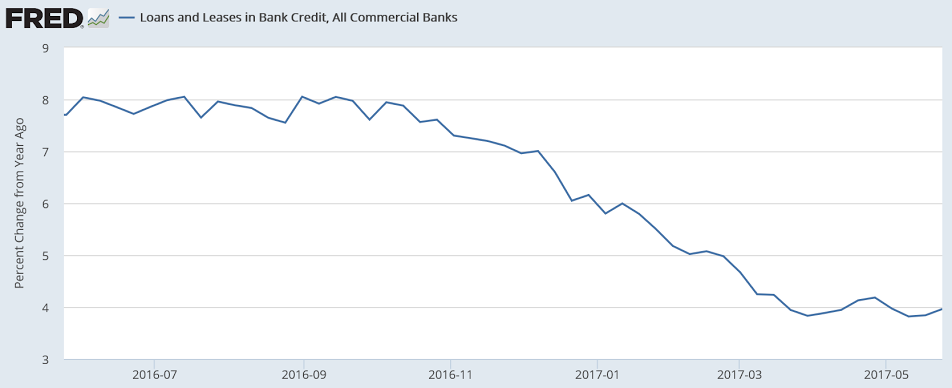
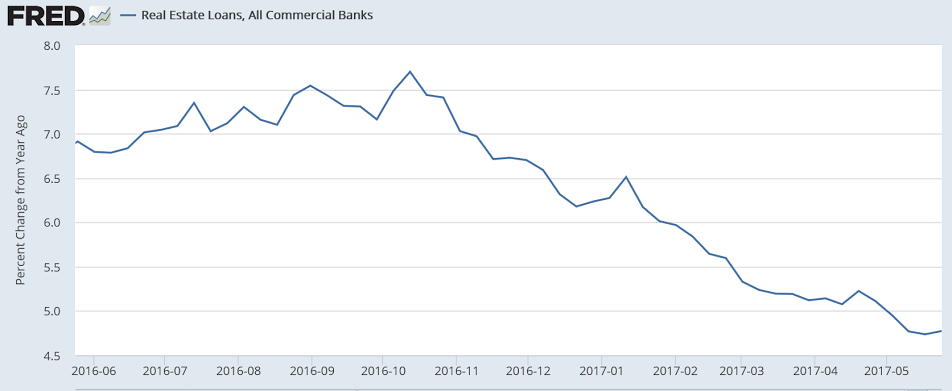
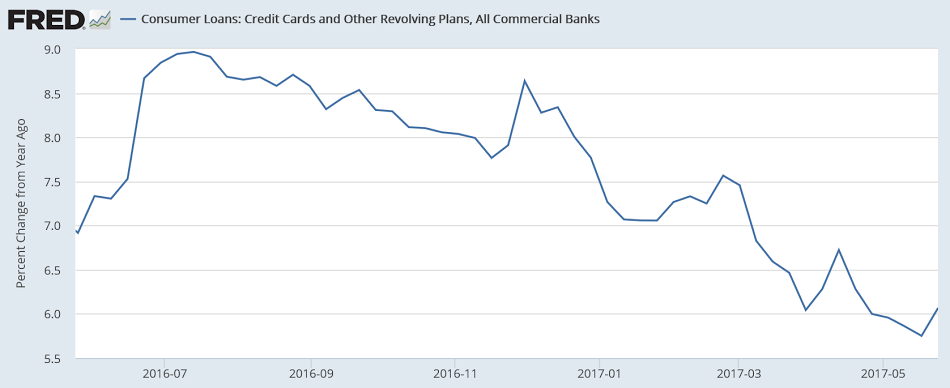
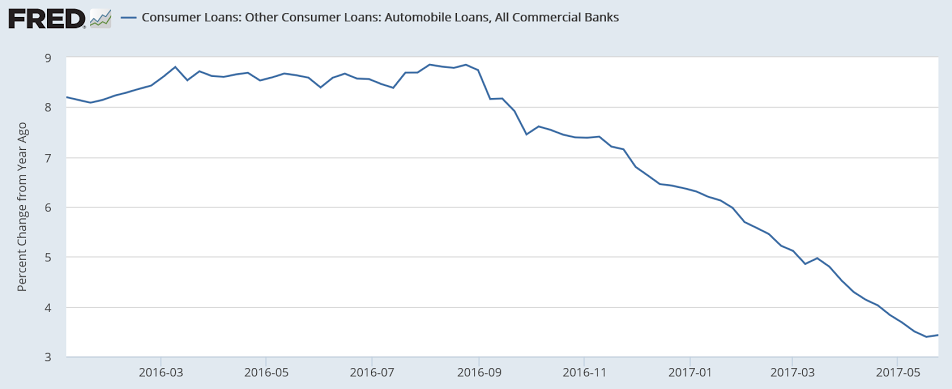
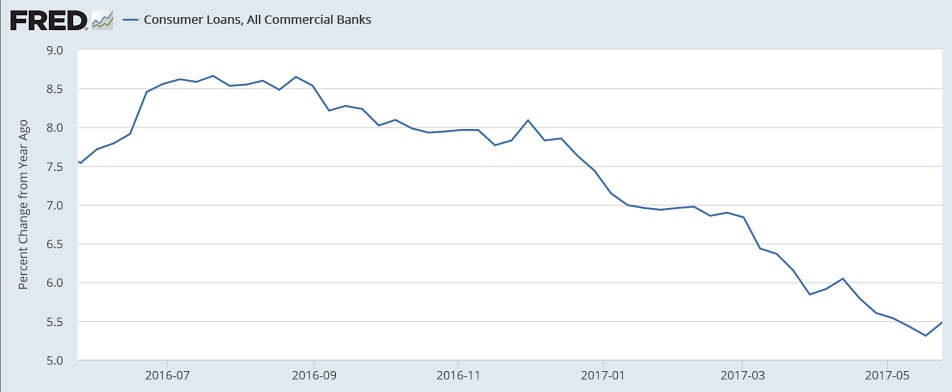
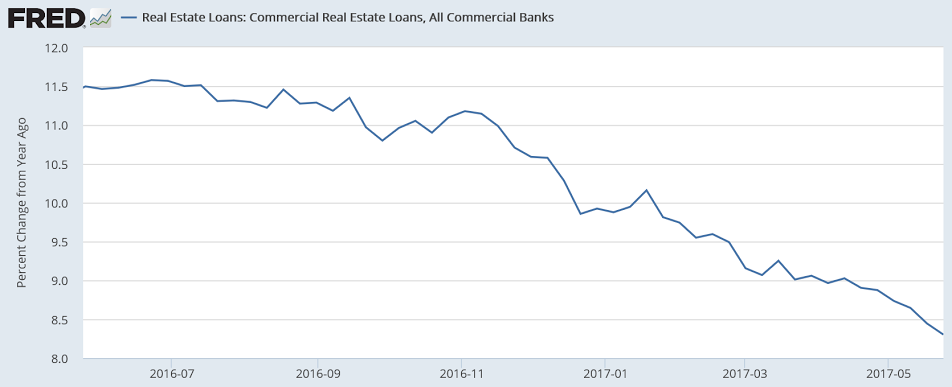
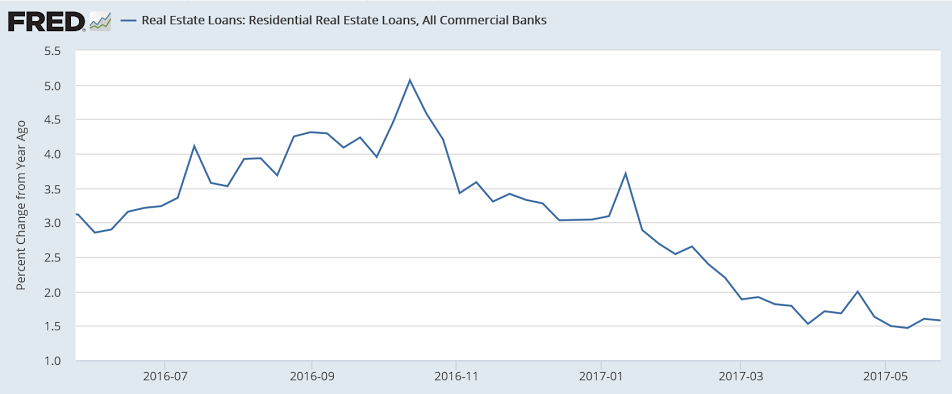
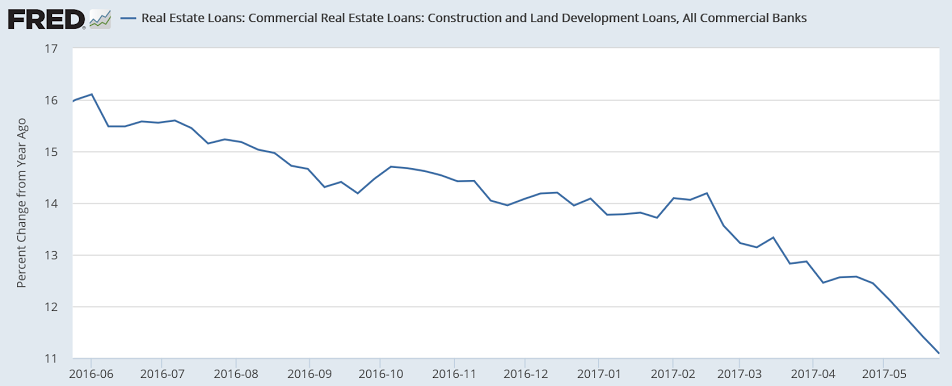
The charts show it all went bad around November. And it continues to deteriorate with every passing week, with the latest data showing cars, housing, and employment decelerating accordingly.Must have been some event that set it off? It was around the time of the election, but I can’t recall specifically what would set off something like this?Comments welcome!
Topics:
WARREN MOSLER considers the following as important: Uncategorized
This could be interesting, too:
tom writes The Ukraine war and Europe’s deepening march of folly
Stavros Mavroudeas writes CfP of Marxist Macroeconomic Modelling workgroup – 18th WAPE Forum, Istanbul August 6-8, 2025
Lars Pålsson Syll writes The pretence-of-knowledge syndrome
Dean Baker writes Crypto and Donald Trump’s strategic baseball card reserve
The charts show it all went bad around November. And it continues to deteriorate with every passing week, with the latest data showing cars, housing, and employment decelerating accordingly.
Must have been some event that set it off? It was around the time of the election, but I can’t recall specifically what would set off something like this?
Comments welcome!
