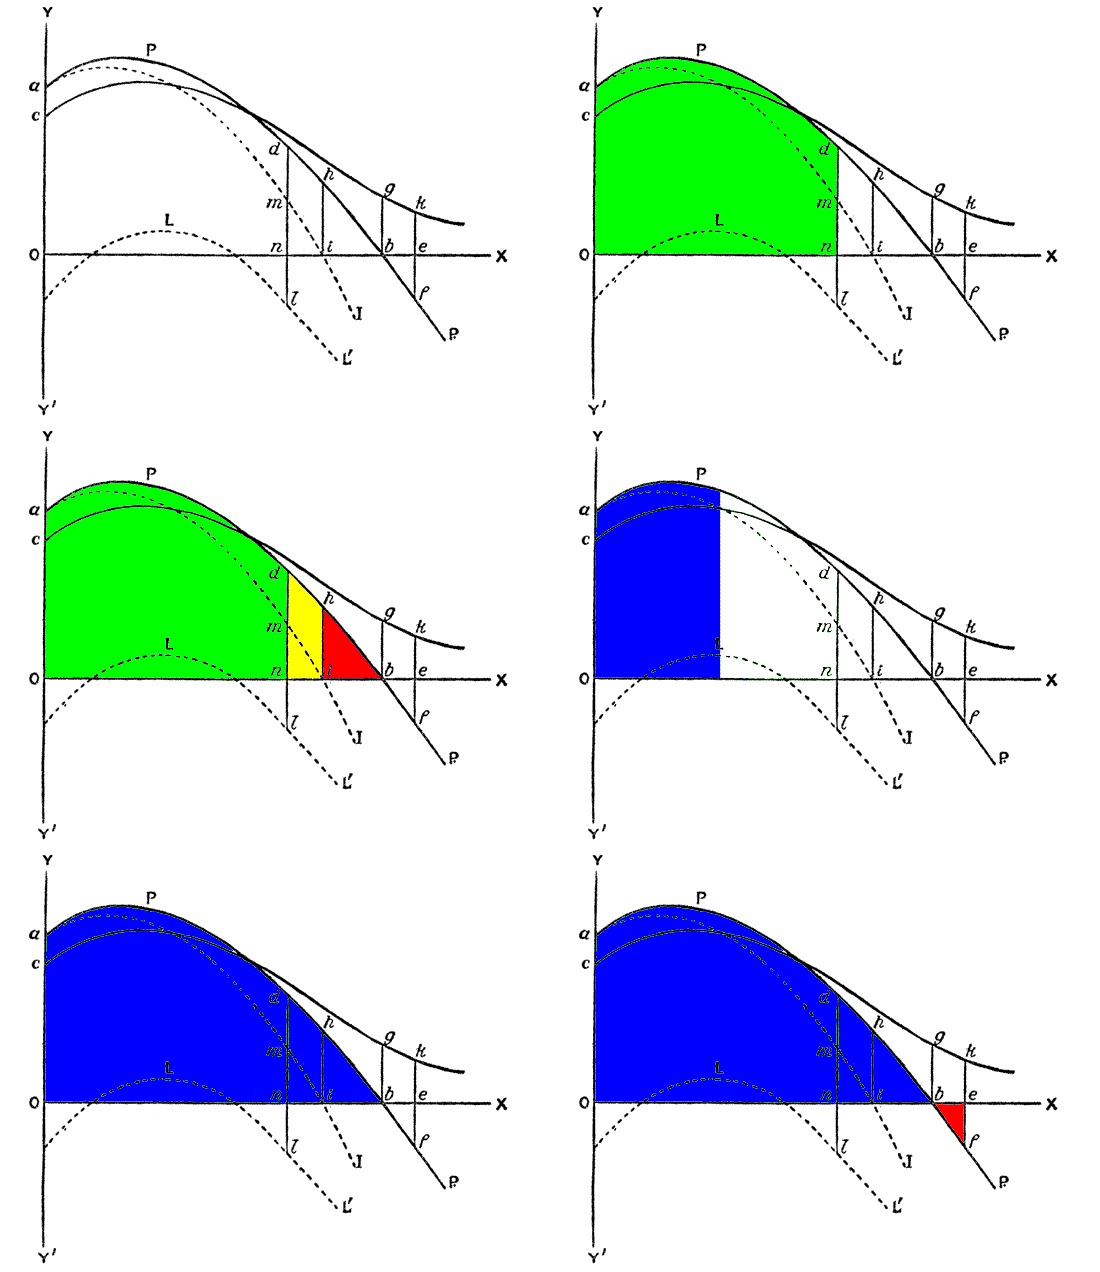
Is there a neo-classical theory of immiseration? Below is the marvelous Chapman hours of labor diagram (follow the link for a more detailed explanation). It looks complicated but it really only contains four curves representing, roughly, long-term and short-term productivity, income and fatigue. But there is more to it than Chapman realized or that I have previously noticed. The context for this diagram is William Stanley Jevons’s discussion of work effort in his Theory of Political Economy: A few hours’ work per day may be considered agreeable rather than otherwise; but so soon as the overflowing energy of the body is drained off, it becomes irksome to remain at work. As exhaustion approaches, continued effort becomes more and more intolerable. The “L”
Topics:
Sandwichman considers the following as important: Uncategorized
This could be interesting, too:
tom writes The Ukraine war and Europe’s deepening march of folly
Stavros Mavroudeas writes CfP of Marxist Macroeconomic Modelling workgroup – 18th WAPE Forum, Istanbul August 6-8, 2025
Lars Pålsson Syll writes The pretence-of-knowledge syndrome
Dean Baker writes Crypto and Donald Trump’s strategic baseball card reserve
The context for this diagram is William Stanley Jevons’s discussion of work effort in his Theory of Political Economy:
A few hours’ work per day may be considered agreeable rather than otherwise; but so soon as the overflowing energy of the body is drained off, it becomes irksome to remain at work. As exhaustion approaches, continued effort becomes more and more intolerable.
The “L” curve in Chapman’s diagram echoes the lower curve in Jevons’s figure VIII, presented to illustrate the “painfulness of labour in proportion to produce”:
In this diagram the height of points above the line ox denotes pleasure, and depth below it pain. At the moment of commencing labour it is usually more irksome than when the mind and body are well bent to the work. Thus, at first, the pain is measured by oa. At b there is neither pain nor pleasure. Between b and c an excess of pleasure is represented as due to the exertion itself. But after c the energy begins to be rapidly exhausted, and the resulting pain is shown by the downward tendency of the line cd.
Chapman was primarily concerned with the length of the day optimal for output, which would be measured on the X axis of his diagram by the distance Ob. The optimal working day from the workers’ perspective, however, would be On and would terminate at the point where the marginal income from another time unit of work would just equal the marginal pain of working.
But the intervals from n to i and from i to b add another dimension to the diagram that has been overlooked. From n to i the worker gives up proportionally more in work effort than he or she receives in extra income. Finally, during the interval from i to b, workers endure additional pain in exchange for a decrease in total income. Beyond b, the incomes of both workers and employers are reduced.
The four phases of working time can be labeled cooperation, exploitation, immiseration and ruin. The incentive for employers is to progress inexorably toward the last phase unless regulated by legislation or collective bargaining. The following animation illustrates the contrast between the workers’ gains (green) and losses from lengthening of the working day and the employers’ gains (blue) and loses.
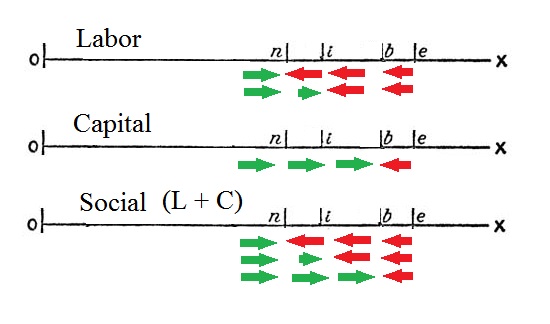
The conflict between labor and capital over the length of the working day can also be illustrated less kinetically by the following close-up of the X axis from Chapman’s diagram. The green arrows indicate income gains, the red arrows income losses or pain cost:
The bottom line, showing the social aggregate, indicates that the income gain for capital at the optimal point b for output is essentially a transfer of income from labor, which also has to invest additional work effort to accomplish that transfer. Up to the output optimum point there is a small net surplus of income that is, however, dwarfed by the quantity of work effort pain cost required to generate it. This does not even qualify for the Kaldor-Hicks compensation criteria. From capital’s perspective, however, the small net return and larger transfer appears to be all simply gain from expanded output — growth is good! (Just don’t look under the hood).
Chapman gave no indication of being aware of the immiseration implications of his analysis. John Hicks gave even clearer indication that he was not aware of the immiseration implications of Chapman’s analysis. Hicks observed that “it had never entered the heads of most employers that it was at all conceivable that hours could be shortened and output maintained” but asserted that trade unions “will not usually need to exert any considerable pressure in order to bring about a reduction” in circumstances where the working day exceeded the output optimum. As if workers should be content to be ground down into wretched poverty provided they didn’t drag their employer down with them! The output optimum is not a good place on the X axis for workers to be.
Only the Marxist economist, Maurice Dobb, appears to have noticed the importance of the relationship between wages and “the worker’s expenditure of energy and his ‘wear and tear.’”
What was implied in the economists’ retort to the advocates of the so-called Work-Fund leads to the apparent paradox that the more the workers allow themselves to be exploited, the more their aggregate earnings will increase (at least in the long run), even if the result is for the earnings of the propertied class to increase still faster. And on this base is erected a doctrine of social harmony between the classes. But it does not follow that the workers will prefer to be exploited to a maximum degree, or that attempts to limit this exploitation are based on fallacious reasoning.
There is no scale on the Chapman diagram and this turns out to be a useful feature. Different occupations, technologies, individuals and wage levels generate a variety of scales. One could conceive of aggregating these scales either in an overall average or clustered in quintile or decile groups. The latter procedure would be valuable in exploring whether a substantial number of workers were being pushed into conditions of immiseration even though the overall average was still safely in the exploitation range.
It is worth remarking that based on the relative length of the segments in Chapman’s diagram, the optimal length of the day for workers would be less that 72 percent of the optimal output day. For example, if the optimal length of the workweek for output was 48 hours, the optimal week for workers would be 34.4 hours. Of course Chapman’s diagram is not based on empirical measurement but Chapman had investigated in depth the extensive statistical and experimental data available at the time he was formulating his theory, so, while his proportions cannot be assumed to be precise they probably represent an informed impression — a ballpark estimate — of general relationships.
In conclusion, yes, there is a neo-classical immiseration theory. The economists who propounded it apparently were unaware that it was such a theory. By extension, that immiseration theory is a crisis theory. There is no built-in mechanism of negative feedback from prices that militates against the passage from the immiseration phase to the ruin phase. Hicks assumed that a “very moderate degree of rationality on the part of employers will thus lead them to reduce hours to the output optimum as soon as Trade Unionism has to be reckoned with at all seriously [emphasis added].” But by the time exploitation has progressed to the immiseration phase, trade unionism doesn’t have to be “reckoned with at all seriously” by employers. The trade unions would already have been defeated somewhere between point n and point b on the Chapman diagram’s X axis.


