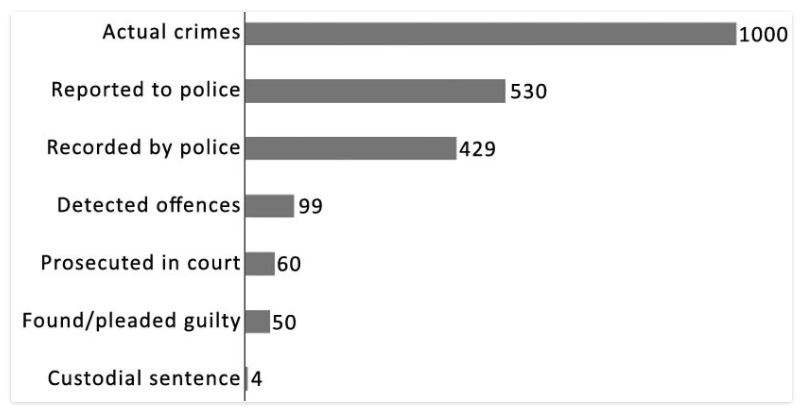
I stumbled on a blog post by Jerry Ratcliffe, who is a Professor of Criminal Justice and Director of the Center for Security and Crime Science at Temple University, Philadelphia, and a former police officer with London’s Metropolitan Police (UK). From one of this posts: Graph no. 2 is another image from my Intelligence-Led Policing book. The crime funnel represents what happens to a random selection of 1,000 crimes that affect the public (top bar). It shows the loss of cases through the criminal justice system. These are British national data derived from public records, but the comparisons to the U.S. are very similar. If you take a random selection of 1,000 crimes actually suffered by the public (violence, robbery, vehicle theft, residential burglary,
Topics:
Mike Kimel considers the following as important: crime and punishment, Policing, Uncategorized
This could be interesting, too:
tom writes The Ukraine war and Europe’s deepening march of folly
Stavros Mavroudeas writes CfP of Marxist Macroeconomic Modelling workgroup – 18th WAPE Forum, Istanbul August 6-8, 2025
Lars Pålsson Syll writes The pretence-of-knowledge syndrome
Dean Baker writes Crypto and Donald Trump’s strategic baseball card reserve
I stumbled on a blog post by Jerry Ratcliffe, who is a Professor of Criminal Justice and Director of the Center for Security and Crime Science at Temple University, Philadelphia, and a former police officer with London’s Metropolitan Police (UK).
From one of this posts:
Graph no. 2 is another image from my Intelligence-Led Policing book. The crime funnel represents what happens to a random selection of 1,000 crimes that affect the public (top bar). It shows the loss of cases through the criminal justice system. These are British national data derived from public records, but the comparisons to the U.S. are very similar. If you take a random selection of 1,000 crimes actually suffered by the public (violence, robbery, vehicle theft, residential burglary, theft and criminal damage) you can see that they only report 530 to the police, who in turn record just 43 percent of the original total.
Click to embiggenize.
Of these 429 events, 99 are detected (solved or cleared in some way) and of these, 60 end up with a day in court. The majority of those are found guilty or plead the same, but in the end only four of the events from the original 1,000 end up in a custodial sentence for the offender. This is an incarceration rate of 0.4% based on crime suffered by the community.
The main point here is that impacting higher in the crime funnel will be more effective because it affects the numbers below and affects a larger number of actual cases. Improving the detection rate will have an impact on prosecutions, pleas and incarceration, but only to a minimal level. Being prevention focused and changing the higher numbers is much more impactful. Consider if you could have a 10% change on one level. Where would it be most effective?
I don’t know how accurate the figures above are, but I assume the numbers are about as reasonable as the law enforcement community can provide. I’m not sure “an incarceration rate of 0.4% based on crime suffered by the community” is all that much of a deterrent, except insofar as crimes, apparently are just like potato chips – people who engage in crimes generally don’t stop at one. Most delinquents commit multiple crimes and eventually get snagged for something. But meanwhile, a whole of of people suffer a whole of outrage.
As to Ratcliffe’s question… I suspect what Ratclife is getting at is what the current esteemed leadership in Baltimore considers heavy handed policing. And I bet his 0.4% figure is a whole lot lower for Baltimore these days too.

