Patrick Ruffini tweeted a graph showing a break in the trend of health care cost inflation with the ironic comment “The “Affordable” Care Act sure has bent the cost curve.” In the graph he posted, it is broken not bent. h/t @ChrisDeLong_ The trick is that the graph starts in 1996 & includes college tuition and software, so the huge change looks tiny. In comments, it is clear that other people can’t see what is right in front of their eyes (good thing the ACA covers eye exams). Jon Chait helps out by graphing inflation not the price level and leaving out other goods and services with huge changes. I just asked Fred. I look at the ratio of health care PCE chained indes to the overall PCE deflator. Chait shows a huge decline in overall inflation, which isn’t relevant. Here is an (admittedly annual graph) which sure looks bent to me Ideology prevents people from seeing what’s right in front of their eyes.
Topics:
Robert Waldmann considers the following as important: Healthcare
This could be interesting, too:
Bill Haskell writes Families Struggle Paying for Child Care While Working
Joel Eissenberg writes RFK Jr. blames the victims
Joel Eissenberg writes The branding of Medicaid
Bill Haskell writes Why Healthcare Costs So Much . . .
Patrick Ruffini tweeted a graph showing a break in the trend of health care cost inflation with the ironic comment “The “Affordable” Care Act sure has bent the cost curve.” In the graph he posted, it is broken not bent.

h/t @ChrisDeLong_
The trick is that the graph starts in 1996 & includes college tuition and software, so the huge change looks tiny.
In comments, it is clear that other people can’t see what is right in front of their eyes (good thing the ACA covers eye exams).
Jon Chait helps out by graphing inflation not the price level and leaving out other goods and services with huge changes.
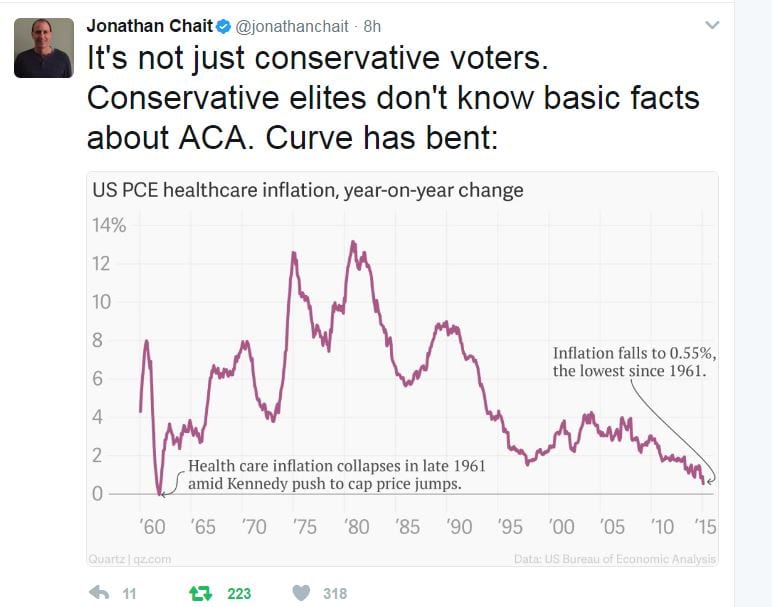
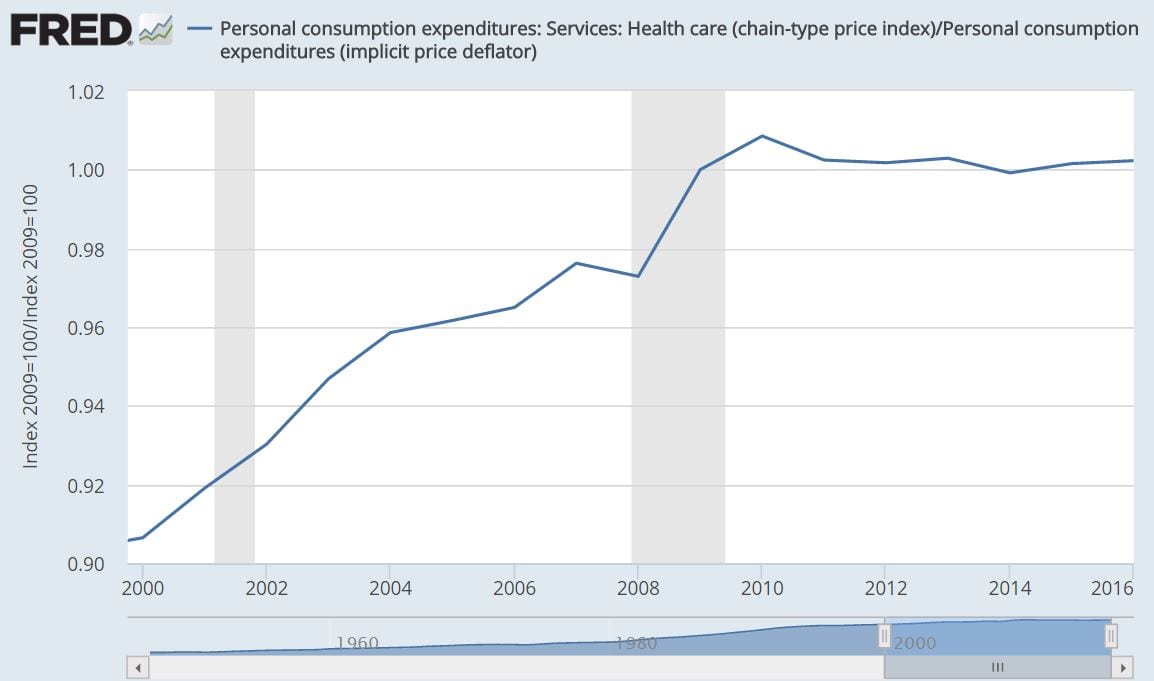
I just asked Fred. I look at the ratio of health care PCE chained indes to the overall PCE deflator. Chait shows a huge decline in overall inflation, which isn’t relevant. Here is an (admittedly annual graph) which sure looks bent to me
Ideology prevents people from seeing what’s right in front of their eyes.