I had a post the other day trying to make sense of changes in healthcare costs. Based on some of the comments to that post, a bit more thought, some data from the Centers for Medicare and Medicaid Services, and the CPI-All Urban Consumers, I think my point distills down to this graph: (click to embiggen) The graph shows the annual YoY change in real healthcare costs defined three three ways. The green line shows the annual change in total healthcare expenditures (adjusted for inflation). The blue line shows the annual change in healthcare expenditures (adjusted for inflation) per capita. The red line is the same as the blue line, but looks at the annual change in personal healthcare expenditures (adjusted for inflation) per capita. Anyway, what the graph
Topics:
Mike Kimel considers the following as important: healthcare costs, PPACA, Uncategorized
This could be interesting, too:
tom writes The Ukraine war and Europe’s deepening march of folly
Stavros Mavroudeas writes CfP of Marxist Macroeconomic Modelling workgroup – 18th WAPE Forum, Istanbul August 6-8, 2025
Lars Pålsson Syll writes The pretence-of-knowledge syndrome
Dean Baker writes Crypto and Donald Trump’s strategic baseball card reserve
I had a post the other day trying to make sense of changes in healthcare costs. Based on some of the comments to that post, a bit more thought, some data from the Centers for Medicare and Medicaid Services, and the CPI-All Urban Consumers, I think my point distills down to this graph:
(click to embiggen)
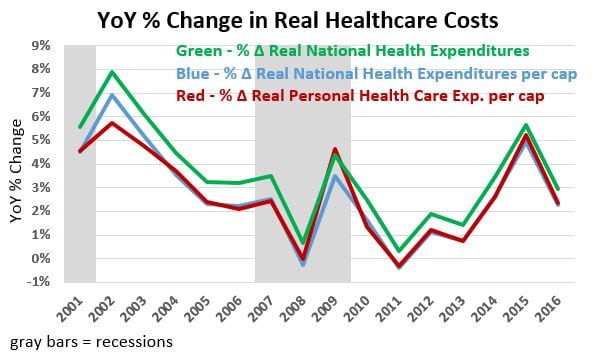
The graph shows the annual YoY change in real healthcare costs defined three three ways. The green line shows the annual change in total healthcare expenditures (adjusted for inflation). The blue line shows the annual change in healthcare expenditures (adjusted for inflation) per capita. The red line is the same as the blue line, but looks at the annual change in personal healthcare expenditures (adjusted for inflation) per capita.
Anyway, what the graph shows is that the rate at which inflation adjusted healthcare costs (I provided three flavors to show they all behave more or less the same) increased fell reasonably consistently from 2002 to 2008. I.e., costs continued to increase until 2007, but at a decreasing rate. And in 2008, real healthcare costs were actually lower than in 2007!! There was a spike in 2009, and then prices started coming down again… until 2011. After that, they rose until to 2015 and dropped again in 2016. Is 2016 a blip, a fluke, or the start of a new trend? Time will tell. This isn’t a topic I know enough about to make a prediction. That said, right at this moment, the graph doesn’t look to me like what I’d expect to see if 2010 marked the passage of a law that bent the cost curve. Or rather, not like a law that bent the cost curve in the right direction.
If you want my data, drop me a line at my first name (mike) period my last name (only one m people!!!) at gmail period com. I’m sticking a time limit of one month from this post going up on the request. Beyond that point, you might get lucky but I don’t guarantee anything.
Update… 7:40 PM PST Jan 3, 2017. Due to some of the comments on the earlier post, I added the paragraph that begins “The graph shows the annual…” plus other minor edits for clarity.