It is doubtful Trump reads much beyond his own signature on Executive Orders and Twitter commentary. Someone is attempting to align him with current thinking creating a persona of his being a thoughtful and reasoning president as opposed to . . . ? In “Again, Healthcare Cost Drivers Pharma, Doctors, and Hospitals ,” I had posted stats from a 2016 JAMA paper covering the period from 1996 to 2013. Healthcare costs had increased trillion of which 50% was due solely to pricing. One significant factor in the JAMA report was the billion increase in costs for diabetes treatment of which billion was due to pharmaceuticals pricing. One impact to diabetes treatment was Eli Lilly’s increases for Humalog which was per vial in 1996. By 2017, the
Topics:
run75441 considers the following as important: Healthcare, Hot Topics, Taxes/regulation
This could be interesting, too:
NewDealdemocrat writes JOLTS revisions from Yesterday’s Report
Joel Eissenberg writes No Invading Allies Act
Bill Haskell writes Families Struggle Paying for Child Care While Working
NewDealdemocrat writes January JOLTS report: monthly increases, but significant downward revisions to 2024
It is doubtful Trump reads much beyond his own signature on Executive Orders and Twitter commentary. Someone is attempting to align him with current thinking creating a persona of his being a thoughtful and reasoning president as opposed to . . . ?
In “Again, Healthcare Cost Drivers Pharma, Doctors, and Hospitals ,” I had posted stats from a 2016 JAMA paper covering the period from 1996 to 2013. Healthcare costs had increased $1 trillion of which 50% was due solely to pricing. One significant factor in the JAMA report was the $66 billion increase in costs for diabetes treatment of which $44 billion was due to pharmaceuticals pricing. One impact to diabetes treatment was Eli Lilly’s increases for Humalog which was $21 per vial in 1996. By 2017, the price increased to $275 (700%) for a vial, a one-month supply. Humalog is a decades old drug and the manufacturing has not changed significantly.
“JAMA Network Open” has issued an end of May 2018 paper on pharmaceutical pricing trends covering the years from the period 2012 – 2017, “Trends in Prices of Popular Brand-Name Prescription Drugs in the United States.” The question it asks:
• What are the prices of top-selling brand-name prescription drugs in the United States and how have these prices changed in recent years?
answer:
• In this evaluation of 49 common top-selling brand-name drugs; 78% of the drugs have been available since 2012, have seen an increase in insurer and out-of-pocket costs by more than 50%, and 44% have more than doubled in price.
and concludes:
• Brand-name drug pricing associated with government-protected market exclusivity is likely to continue to increase and warrants greater price transparency.
Similar to what President Trump has proposed which “still” does not empower constituents to seek alternatives and typically the alternatives are just as costly.
Study Methodology
Data was obtained of 35 million individuals from the Blue Cross Shield Axis (data base) for the time period of January 2012 through December 2017. The researchers reviewed prescribed drugs exceeding $500 million in US sales or $1 billion in worldwide sales.
Within the identified parameters of 2012-2017 sales, 132 brand-name prescription drugs were identified. 49 of the 132 top-selling drugs exceeded 100 000 pharmacy claims, substantial cost increases among these drugs was experienced within the inclusion parameters with a 76% median cost increase, and 48 of the drugs had regular annual or biannual price increases.
36 of the 49 drugs were available since 2012. 28 had experienced an increase in insurer and out-of-pocket costs exceeding 50% and 16 more than doubled in price. Insulins such as Novolog, Humalog, and Lantus and tumor necrosis factor inhibitors such as Humira and Enbrel experienced highly correlated price increases coinciding with some of the largest growth in drug costs.
The results of the study revealed the median sum of out-of-pocket and insurance costs paid by patients or insurers for common prescriptions and presented both annually and monthly.
Pricing increases for new drugs (13) from January 2015 through December 2017) entering the market in the last 3 to 6 years price was not different than those (36) having been on the market longer, a 29% increase [median] from January 2015 through December 2017.
Nor did the study differentiate between drugs with or without a FDA approved therapeutic equivalent (number of drugs, 17 vs 32; median, 79% vs 73% price change).
Changes in prices paid were highly correlated with third-party estimates of changes in drug net prices (ρ = 0.55; P = 3.8 × 10⁻⁵), suggesting that the current rebate system incentivizes high list prices and greater reliance on rebates resulting in increased overall costs.
“The study concludes the growth of drug spending in the United States associated with government-protected market exclusivity is likely to continue. Greater price transparency is warranted.”
Interpretation? Pharmaceutical companies (and I will include companies such as Mylan [EpiPens]) are using the patent drug laws and resulting exclusivity time period to maximize profit margins ($14.50 for every $1 invested [WHO]) protecting their products from competition. A similar exclusivity holds true for generic products also (time periods for the introduction for a similar generic product). “Can You Patent The Sun (Jonas Salk)?”
I sat over dinner with one Exec. VP from a major pharmaceutical company who confirmed what I had said in an earlier post (Can You Patent The Sun?) and here. A new pricing strategy is being used by pharmaceutical companies which maximizes return based upon benefits achieved in treatment, life, healthcare system, and in society. It is a well thought out reasoning being delivered by intelligent purveyors of healthcare supplies portraying a modicum of caring or concern for societal welfare while pursuing the profit motive. Novartis CEO Vas Narasimhan (not the one I talked to);
“Cell and gene therapies are bringing about a new era of cancer medicines going beyond ‘just improving lives and are saving them.’ The new therapies are challenging the traditional model for paying for medical treatment and the industry is divided on this approach. Pricing for these one-time usage therapies are to be based on four key measures of value – the improvements they offer to patients both clinically and in terms of their quality of life, and the resulting benefits to the health-care system and society.”
The pricing application is not limited to new drugs, cancer meds and gene/cell therapies; it is also being applied to older drugs and also generic replacements.
Findings:
Between 2012 – 2017, the study reveals an industry wide increase in costs for top-selling brand-name prescription drugs and less costly generic replacements. The increase in costs, biannual, and annually for 36 pharmaceuticals since 2012 can also be seen in newer drugs coming on the market after 2012. A pattern or practice of pricing determination based upon 4 values in the pharmaceutical market which will continue into the foreseeable future.
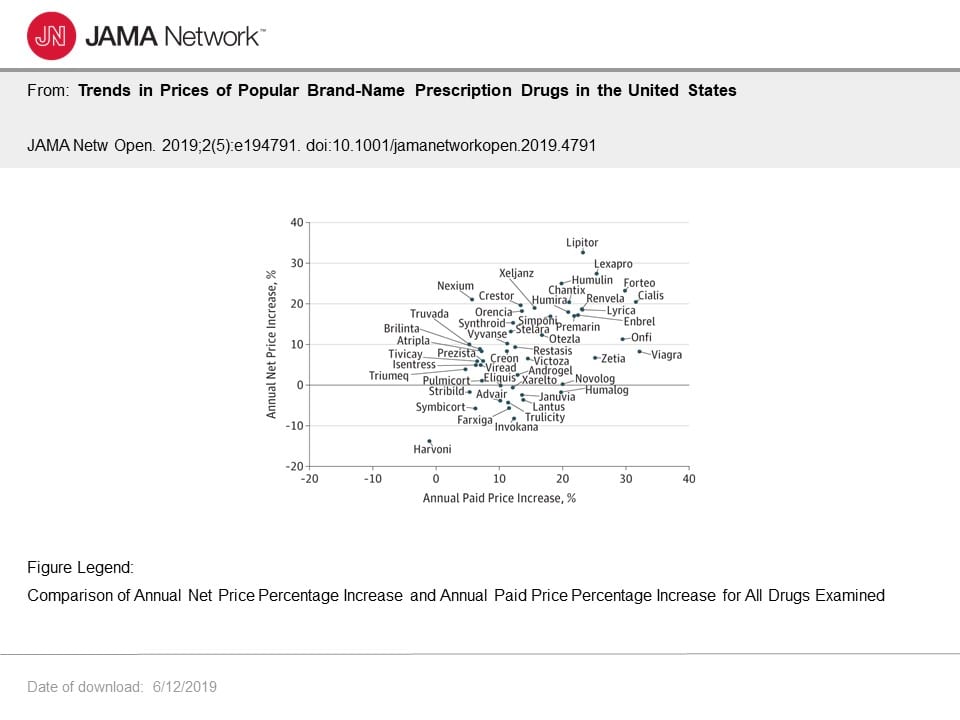 This particular chart depicts annual net price and annual paid price increases showing the percentage increases. This becomes more interesting where I cover “rebates” and whether the reduce costs.
Given median cost increases of 9.5% annually, the yearly increases will result in a doubling of costs for brand name drugs in this study every 7 to 8 years.
New and old brand-name competition does little to control rising costs of products which can be used interchangeably (hence this shoots transparency in the foot for constituents talking to pharmacists) such as Humira and Enbrel or diabetes drugs such as Humalog, Humulin, and Novolog. “Relative cost changes are highly synchronized” resulting in large increases over the last 6 years. As mentioned there appears to be a pattern or practice of pharmaceutical companies acting in concert.
There is little evidence of price changes associated with the existence of therapeutic equivalents such as generics, biosimilar drugs, or drugs entering the market later.
Legislated pricing transparency may lead patients to seek alternative drugs if available which may result in different pricing trends than what was observed over the six years of when the study was done. The impact of such is unknown as is the likelihood of those trends as they may already be in progress due to volume changes or speculation of volume changes due to expiration of exclusivity.
Neither was there evidence of products entering the market 3 to 6 years ago having different trends compared with other drugs in the first years of availability.
Transparency is need in the costing of drugs and the setting of prices by manufacturers. Only in the US, does the manufacturers of the product set the pricing. In Europe, pricing is influenced by governments.
Research and Development
There is a balancing act between reasonable pricing for consumers and the costs for bringing innovative drugs to market. The United States does provides strong patent laws globally. However, legal strategies by the pharmaceutical industry such as patenting the peripheral aspects of a drug (think EpiPen and its cap) extend protections beyond the original patent and delay generic and biosimilar versions. Furthermore, if a generic version brought to market by one company can not be used in the same manner by following the instructions of the brand name version; the company of the patented version can ask the FDA to block the generic version (again think Mylan’s Brand EpiPens and the TEVA generic [See; “Can You Patent The Sun?“]).
Healthcare and pharmaceutical companies can maintain exclusivity and pricing as set by the manufacturer much longer and well beyond the original patent limits with a range of new innovations. In similar countries as the US as found in western Europe, governments set pricing. The end result is a large discrepancy in pricing between the US and European countries for the same drug.
It is near impossible for private insurers to negotiate pharma pricing and Medicare is forbidden to do so. The Institute for Clinical and Economic Review’s value-based price benchmark is one approach to establish appropriate pricing. Using the four key measures the ICER assigned a cost effectiveness value of up to $1,688,000 for Kymriah for its use in children. This analysis takes into account all of the R&D cost in developing a drug, bringing it to market, and the cost save as measured against other therapies. Using the same ICER 4-point value-based analysis and understanding the range effectiveness determined by the ICER, Novartis set Kymriah list price for pediatric use at $475,000, well below the ICER’ cost effectiveness value, and $373,000 for adult cancers.
So, how is this drug paid for by the less financially endowed patients? Coupons by the manufacturer and rebates to the insurance payor set a net price for the patient which is price and profit neutral.
Rebates
Several points; Transparency of how rebates occur and affect net pricing is limited as to the impact of them on the pharmaceutical industry and healthcare insurance, rebates on list prices set by manufacturers are given by the manufacturers to commercial healthcare insurance and some government programs not including Medicare, and the rebates will vary by drug, by payer, and constitute “16% of all private insurer-branded drug spending returned as rebates in 2016.”
Whether rebates lower or increase costs is debated due to the lack of transparency of their application.
Due to the lack of data, this particular JAMA study used third party information or estimates of net price data on each drug. The observations did reveal a high correlation between increases in the rates of insurer and out-of-pocket costs paid for each drug and the net prices (ρ=0.55). The association suggests the offered industry supposition of higher list prices and greater reliance on rebates reducing costs may not be true.
Instead and a bit redundant by me, the paper offers an opposing supposition of increases in list prices, and the resulting increases in insurer and out-of-pocket costs paid, may coincide with increases in net prices, which in turn make these drugs more expensive overall. Seemingly biannual price increases should not be considered benign pricing strategies to offset paid against net price discrepancies in the current rebate system.
If true, this would be a façade making it appear rebates have an impact on final costs to the healthcare system and pricing to the patient. Rebates may only be a shuffling $dollars around.
Greater transparency of the process is needed to determine what is and what is not a cost save. The transparency is not for the purpose of patients deciding what to buy or pharmacists to recommend alternatives; although, it could be used by constituents to support healthcare proposals to bring prices down.
A healthcare system and its coverage without a foundation or mechanisms to control or account for costs is simply a blanket to pricing and hides its impact.
Run75441 (Bill H)