I have been beating the drum for transparency of cost information before granting exclusivity for drugs via patents. With a patent, companies can charge what the market will bear and have demonstrated they will do so on particular drugs such as insulin, Vimovo, EpiPens, etc. as well as other drugs identified in recent papers on Drug Pricing also. The following chart depicts cancer drug Sales Income as it relates to R & D Costs. It is an example of how quickly R & D costs can be recouped for Cancer drugs with the median being 2 to 5 years. To get to the point quickly, of the 156 US FDA-approved cancer medicines identified, 99 had data for more than half of the years since approval and were included in the WHO (Page 23) analysis. Total sales from this set
Topics:
run75441 considers the following as important: Healthcare, Hot Topics
This could be interesting, too:
NewDealdemocrat writes JOLTS revisions from Yesterday’s Report
Joel Eissenberg writes No Invading Allies Act
Bill Haskell writes Families Struggle Paying for Child Care While Working
NewDealdemocrat writes January JOLTS report: monthly increases, but significant downward revisions to 2024
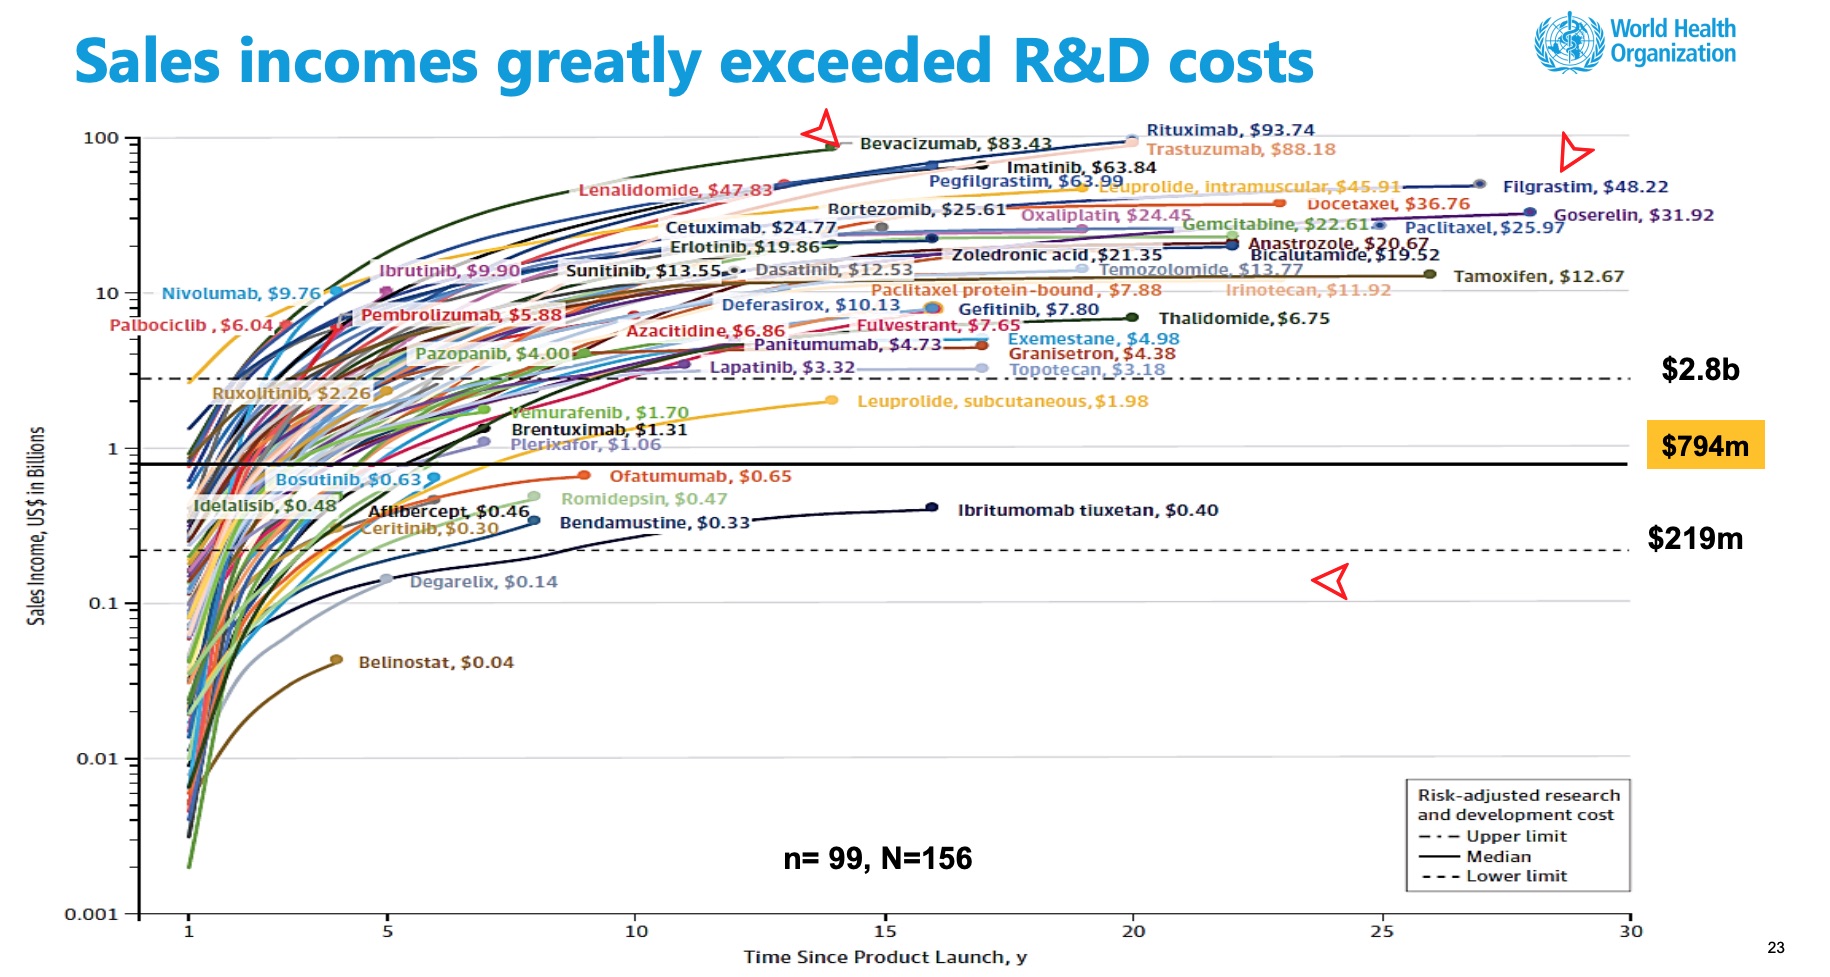
I have been beating the drum for transparency of cost information before granting exclusivity for drugs via patents. With a patent, companies can charge what the market will bear and have demonstrated they will do so on particular drugs such as insulin, Vimovo, EpiPens, etc. as well as other drugs identified in recent papers on Drug Pricing also. The following chart depicts cancer drug Sales Income as it relates to R & D Costs. It is an example of how quickly R & D costs can be recouped for Cancer drugs with the median being 2 to 5 years.
To get to the point quickly, of the 156 US FDA-approved cancer medicines identified, 99 had data for more than half of the years since approval and were included in the WHO (Page 23) analysis. Total sales from this set of medicines (US$ 106.9 billion) represent 80.4% of the estimated global revenue of cancer medicines in 2017 (US$ 133 billion). At the end of 2017, forty-nine (49.5%) of the cancer drugs had cumulative sales of over US$ 5.0 billion and at the end of 2017, five drugs had accrued sales incomes of greater than US$ 50 billion for the originator companies: rituximab (US$93.7 billion), trastuzumab (US$ 88.2 billion), bevacizumab (US$ 83.4 billion), pegfilgrastim (US$ 64.0 billion), imatinib (US$ 63.8 billion) (Fig. 3.5, p.26). Pricing of Cancer Medicines and Its Impacts Technical Report.
The median time to generate revenue to fully cover risk-adjusted R&D cost of US $794 million was 3 years (range: 2 years; 5 years, n=73). For the maximum estimated risk-adjusted cost of R&D (US$ 2.827 Bn), the time to cost recovery was 5 years (range: 2 years; 10 years, n=56). A threshold analysis found that 99% of the 45 cancer medicines with sales data for 10 years from their first year of launch had generated incomes sufficient to at least offset the risk-adjusted R&D costs irrespective of the assumed threshold values for R&D costs (Fig. 3.4).
 Past the Leap, Trends in Prices of Popular Brand-Name Prescription Drugs and why You can not Negotiate Blind Folded
Trends in Prices of Popular Brand-Name Prescription Drugs in the United States, JAMA Network Open, May 2019:
“substantial cost increases among these drugs was experienced within the inclusion parameters with a 76% median cost increase, and 48 of the drugs had regular annual or biannual price increases.
Thirty-six of the 49 drugs were available since 2012. Twenty-eight had experienced an increase in insurer and out-of-pocket costs exceeding 50% and 16 more than doubled in price. Insulins such as Novolog, Humalog, and Lantus and tumor necrosis factor inhibitors such as Humira and Enbrel experienced highly correlated price increases coinciding with some of the largest growth in drug costs.
The results of the study revealed the median sum of out-of-pocket and insurance costs paid by patients or insurers for common prescriptions and presented both annually and monthly.
Pricing increases for 13 new drugs from January 2015 through December 2017) and entering the market in the last 3 to 6 years was not different than those (36) having been on the market longer, a 29% increase [median] from January 2015 through December 2017.
Unsupported Price Increase Report, ICER, Institute for Clinical and Economic Review, October 2019:
Institute for Clinical and Economic Review usually looks at new drugs , analyzes them, and gives a recommendation as to the value of the drug to society and give a price according to the value. Recently the ICE in the Unsupported Price Increase Report compared the percentage increases as shown by the Wholesale Acquisition Cost (WAC – second Column or the top 9 ) to the increase of twice the Medical Care Consumer Price Index (7.32%) over the same period and excluded those drugs with a WAC increase less than 7.32% . . . two times the increase in Medical Care CPI over the same period. The Medical Care CPI is one of eight major components of the CPI recorded and reported by the US Bureau of Labor Statistics.
Medical Care Consumer Price index consists of medical care services (professional services, hospital and related services, and health insurance) and commodities (medical drugs, equipment, and supplies). It is all inclusive. ICER using overall Medical CPI and not a lone services or commodity related one or subcomponent(s) of either or each was to reflect increases in drug prices relative to inflation in the overall price of medical care. The 77 drugs shown in Table 2.2 had an increase in Wholesale Acquisition Cost (WAC) greater than 7.32% over the two-year period (4th quarter 2016 – 4th quarter 2018).
The ICER Table 2.3 depicts 9 of the 77 drugs (Median Total Cost) showing the percentage change in net price (Column 3) over the two-year period from the fourth quarter of 2016 to the fourth quarter of 2018, and the and the increase in drug spending during calendar years 2017 and 2018 and the 4th column depicts net revenue after discounts, rebates, concessions to wholesalers and distributors, and patient assistance programs same as Table 2.2 in the report. Only the ICER Table 2.3 is shown here (JAMA chart above).
The first seven drugs under assessment did not show evidence meeting the criteria of “accepted evidence” in an evaluation system called GRADE. As a result, the seven are reported as having price increases “unsupported by new clinical evidence.”
You Can’t Negotiate Blindfolded Katy Athersuch, Médecins Sans Frontières (MSF) Senior Policy Advisor – Medical Innovation & Access
“From our (World Health Organization) perspective, ‘a fair price’ needs to start with a fair price negotiation and that can only take place if there is transparency.
If you’re negotiating medicine prices with a company that has a monopoly on a particular drug, you as the purchaser are already at a significant disadvantage – particularly if you, or the people on behalf of whom you are negotiating, happen to really need that medicine. The only way to level the power imbalance is by having as much information about the medicine as possible. If you are a government, you will want to know what other countries of similar income levels are paying. You also want to know how much the medicine costs to produce and what is the mark-up. Then there are the costs that went into the research and development of the medicine. You will want to know who has paid what for the R&D – how much of the investment was really covered by the company, and how much was underwritten by taxpayers or through non-profit groups.
The whole discussion about fair pricing makes no sense if one party to the negotiation is blindfolded from the pieces of information which levels the field of informational exchange. The companies hold all the information; they know exactly what price they are charging for each medicine in every single country. They know their costs of development, their costs of production and the returns they stand to make. On the other side of the table you have countries who are trying to negotiate the best price for their population, and they have no idea about any of the above. They are effectively blindfolded. They don’t know what countries like them are paying, they don’t know what countries with a higher income level are paying.”
I have covered quite a bit of ground in reviewing pricing, what is causing the obscene increases, and I have to figure out a way to wrap this up. I have heard the arguments of how difficult it is reveal costs. At the same time, it is far too easy to grant exclusivity for a particular drug which gives the manufacturer cart blanche in establishing prices. Each of the articles I cite (hopefully you read the snippets of information) confirms prices increase biannually and annually, increases greater than Medical CPI, and in return many not delivering increased value to the patient, society, healthcare, etc., and sales revenue surpassing therisk adjusted R&D costs in median periods of 2 to 5 years which is far less than patent exclusivity.
What more does it take?
Run75441 (Bill H)