Polls vs Polls plus. Rule number 1 of forecasting is do not quarrel with fivethirtyeight.com Rule number 538 is not ever. So here I go. I am going to start with the fivethirtyeight Senate forecast(s). (s) because there are three and an “pick a model” icon to toggle them. I like the “lite” just polls forecast. I like it because it estimates a 70% probability of a Democratic majority, while the “Classic” “polls, fundraising, past voting patterns and more” model gives them only a 67% chance and the “Deluxe” “we add experts’ ratings to the classic” gives them only 62%. Which model is optimal ? The Deluxe model gives the best fit with past elections — this must be true because it nests the other two. It would be true also if the deluxe model gave worse
Topics:
Robert Waldmann considers the following as important: politics
This could be interesting, too:
Robert Skidelsky writes Lord Skidelsky to ask His Majesty’s Government what is their policy with regard to the Ukraine war following the new policy of the government of the United States of America.
Joel Eissenberg writes No Invading Allies Act
Ken Melvin writes A Developed Taste
Bill Haskell writes The North American Automobile Industry Waits for Trump and the Gov. to Act
Polls vs Polls plus.
Rule number 1 of forecasting is do not quarrel with fivethirtyeight.com
Rule number 538 is not ever.
So here I go. I am going to start with the fivethirtyeight Senate forecast(s). (s) because there are three and an “pick a model” icon to toggle them. I like the “lite” just polls forecast. I like it because it estimates a 70% probability of a Democratic majority, while the “Classic” “polls, fundraising, past voting patterns and more” model gives them only a 67% chance and the “Deluxe” “we add experts’ ratings to the classic” gives them only 62%.
Which model is optimal ? The Deluxe model gives the best fit with past elections — this must be true because it nests the other two. It would be true also if the deluxe model gave worse forecasts. Generally, the problem is over-fitting if one estimates many parameters. The Deluxe model adds few new parameters (I guess only one but I won’t check). An argument against it has to be not the standard watch out for overfitting argument (It will also outperform using the Akaike Information Criterion).
So how can I argue against it (and then go on to argue against the classic model)) ? Basically, I will argue that things have changed, so past performance is not a reliable indicator of future performance. Some changes are obvious — many more polls are conducted than used to be. Everyone, even experts, knows about averaging polls and how much better it works than looking at them and trying to judge. There is extreme turmoil.
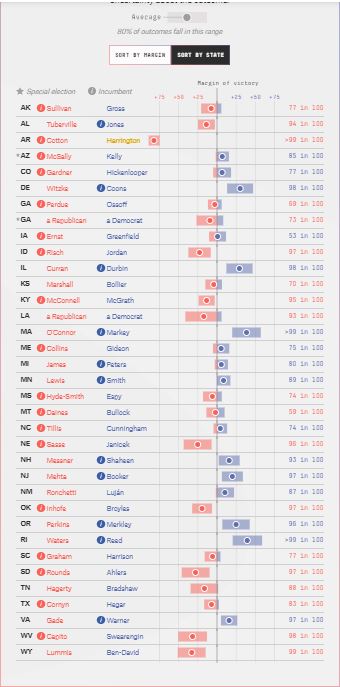
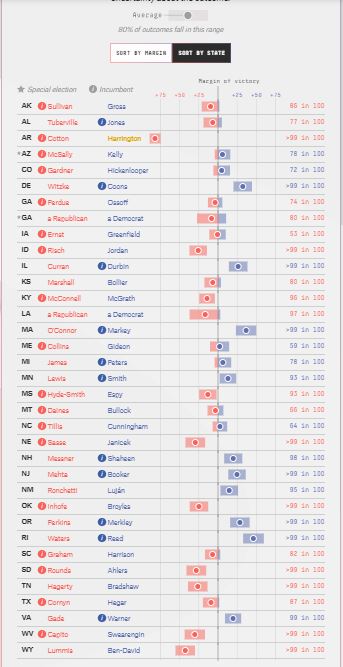
OK now something along the line of evidence. I am going to present data with states in alphabetical order (and below selected so the figure is almost legible).
Here are lite (polls only) forecasts
You can see (if you have excellent eyes — fewer but larger numbers after the jump) that the deluxe forecasts are systematically more favorable to Republicans than the lite forecasts. This would be very unlikely if all of polls, money raised, past voting, and experts’ ratings gave unbiased estimates. The logic of addiing more useful variables is that it increases the precision of the estimates not that it eliminates bias. If there has been a shift of support from Republicans to Democrats, then forecasts based on past voting will be biased in favor of Republicans. It still often makes sense to include data on past voting, because it reduces the variance due to random sampling of the forecast. There are two arguments against — one is that the error in polls has low (not zero) correlation from state to state (one part of it is the change in true public opinion from polling day to election day) so, while each state forecast’s mean squared error is reduced by adding past voting patters as an explanatory variable, the nationwide calculations are worseened.
Another argument is (see above) there are many more polls than their used to be. This makes polling averages better forecasts (not as much as it would if each poll had an genuine independent sampling error but still a lot). If one decided on weights optimizing using data on old elections, one would put too low a weigh on the polling average. I think this happened.
The big change comes when experts’ ratings are added. Here one thing is that experts’ ratings are given by category
Solid R, Likely R, leans R, tossup, Leans D, likely D, Solid D. Now lets pretend that the “experts” have learned that the best strategy is to average polls, do a “lite” calculation then classify based on estimated probabilities. Such “experts” would add no useful information and would remove information. Also they would outperform the other “experts” just as Nate Silver systematically outperformed the previously recognized experts.
The key word here is “learned”. I speculated about a change over time from experts trying to infer without relying totally on polls to experts presenting polling averages as judgment calls.
This is a kind of herding. There is a difference between the strategy which enables me to give my best forecast (lowest mean squared error) and that whic make my forecast the most useful contribution to an average. The best strategy for Robert Waldmann would be to just cut and past fivethirtyeight (see above). My effort to improve on their three forecasts by emphasizing one which they don’t headline above the one which they present as the default is an effort to add something useful. Just following them is probably the best strategy to avoid embarrassment. But challenging them might be useful.
My wild guess is that experts have learned to average polls, then use the average to assign races to categories (eliminating useful information) then change a few of the ratings so it isn’t obvious what they did (and so their ratings aren’t identical to those of another expert). If that’s true, then their ratings used to contain useful information and don’t anymore.
OK visibility ahead of neat order.
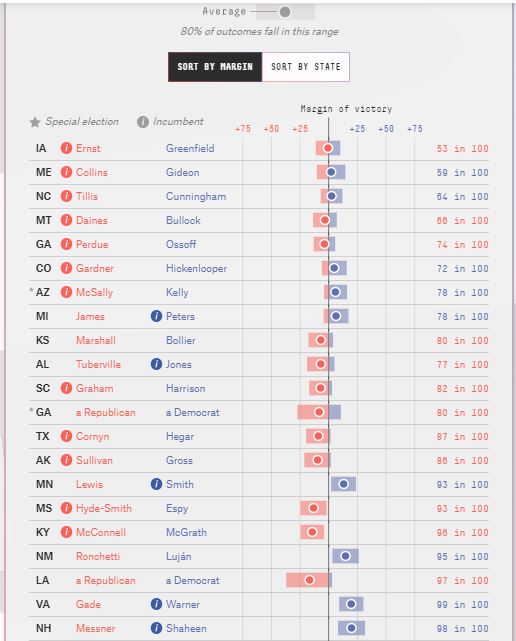
Here are the closer races’ Deluxe forecasts
I cut off the “>99%” estimates.
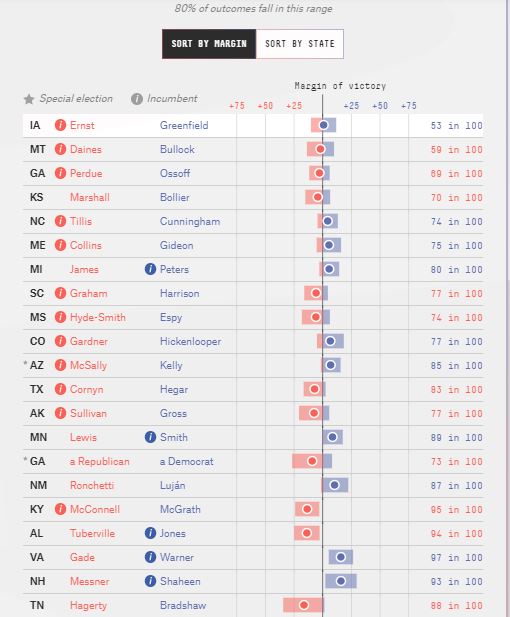
Here are roughly corresponding Lite (polls only) forecasts
I guess it is a hassle that the states are ordered by closeness of the race, but

