Commenter and Blogger RJS, Marketwatch 666, 3rd Quarter GDP Grew at 2.0% Rate even as Real Final Sales of GDP Ticked Lower Our economy grew at a 2.0% rate in the 3rd quarter, quite a bit slower than the growth rate of the second quarter, as increasing consumer outlays for services, greater nonresidential fixed investment, and inventory improvement were offset by decreasing consumer outlays for durable goods, shrinking residential investment, lower exports, and greater imports, which subtracts from other GDP components . . . the Advance Estimate of 3rd Quarter GDP from the Bureau of Economic Analysis estimated that the real output of goods and services produced in the US grew at a 2.0% annual rate over the output of the 2nd quarter, when our real
Topics:
run75441 considers the following as important: MarketWatch 666, RJS, Taxes/regulation, US/Global Economics
This could be interesting, too:
Joel Eissenberg writes How Tesla makes money
Angry Bear writes True pricing: effects on competition
Angry Bear writes The paradox of economic competition
Angry Bear writes USMAC Exempts Certain Items Coming out of Mexico and Canada
Commenter and Blogger RJS, Marketwatch 666, 3rd Quarter GDP Grew at 2.0% Rate even as Real Final Sales of GDP Ticked Lower
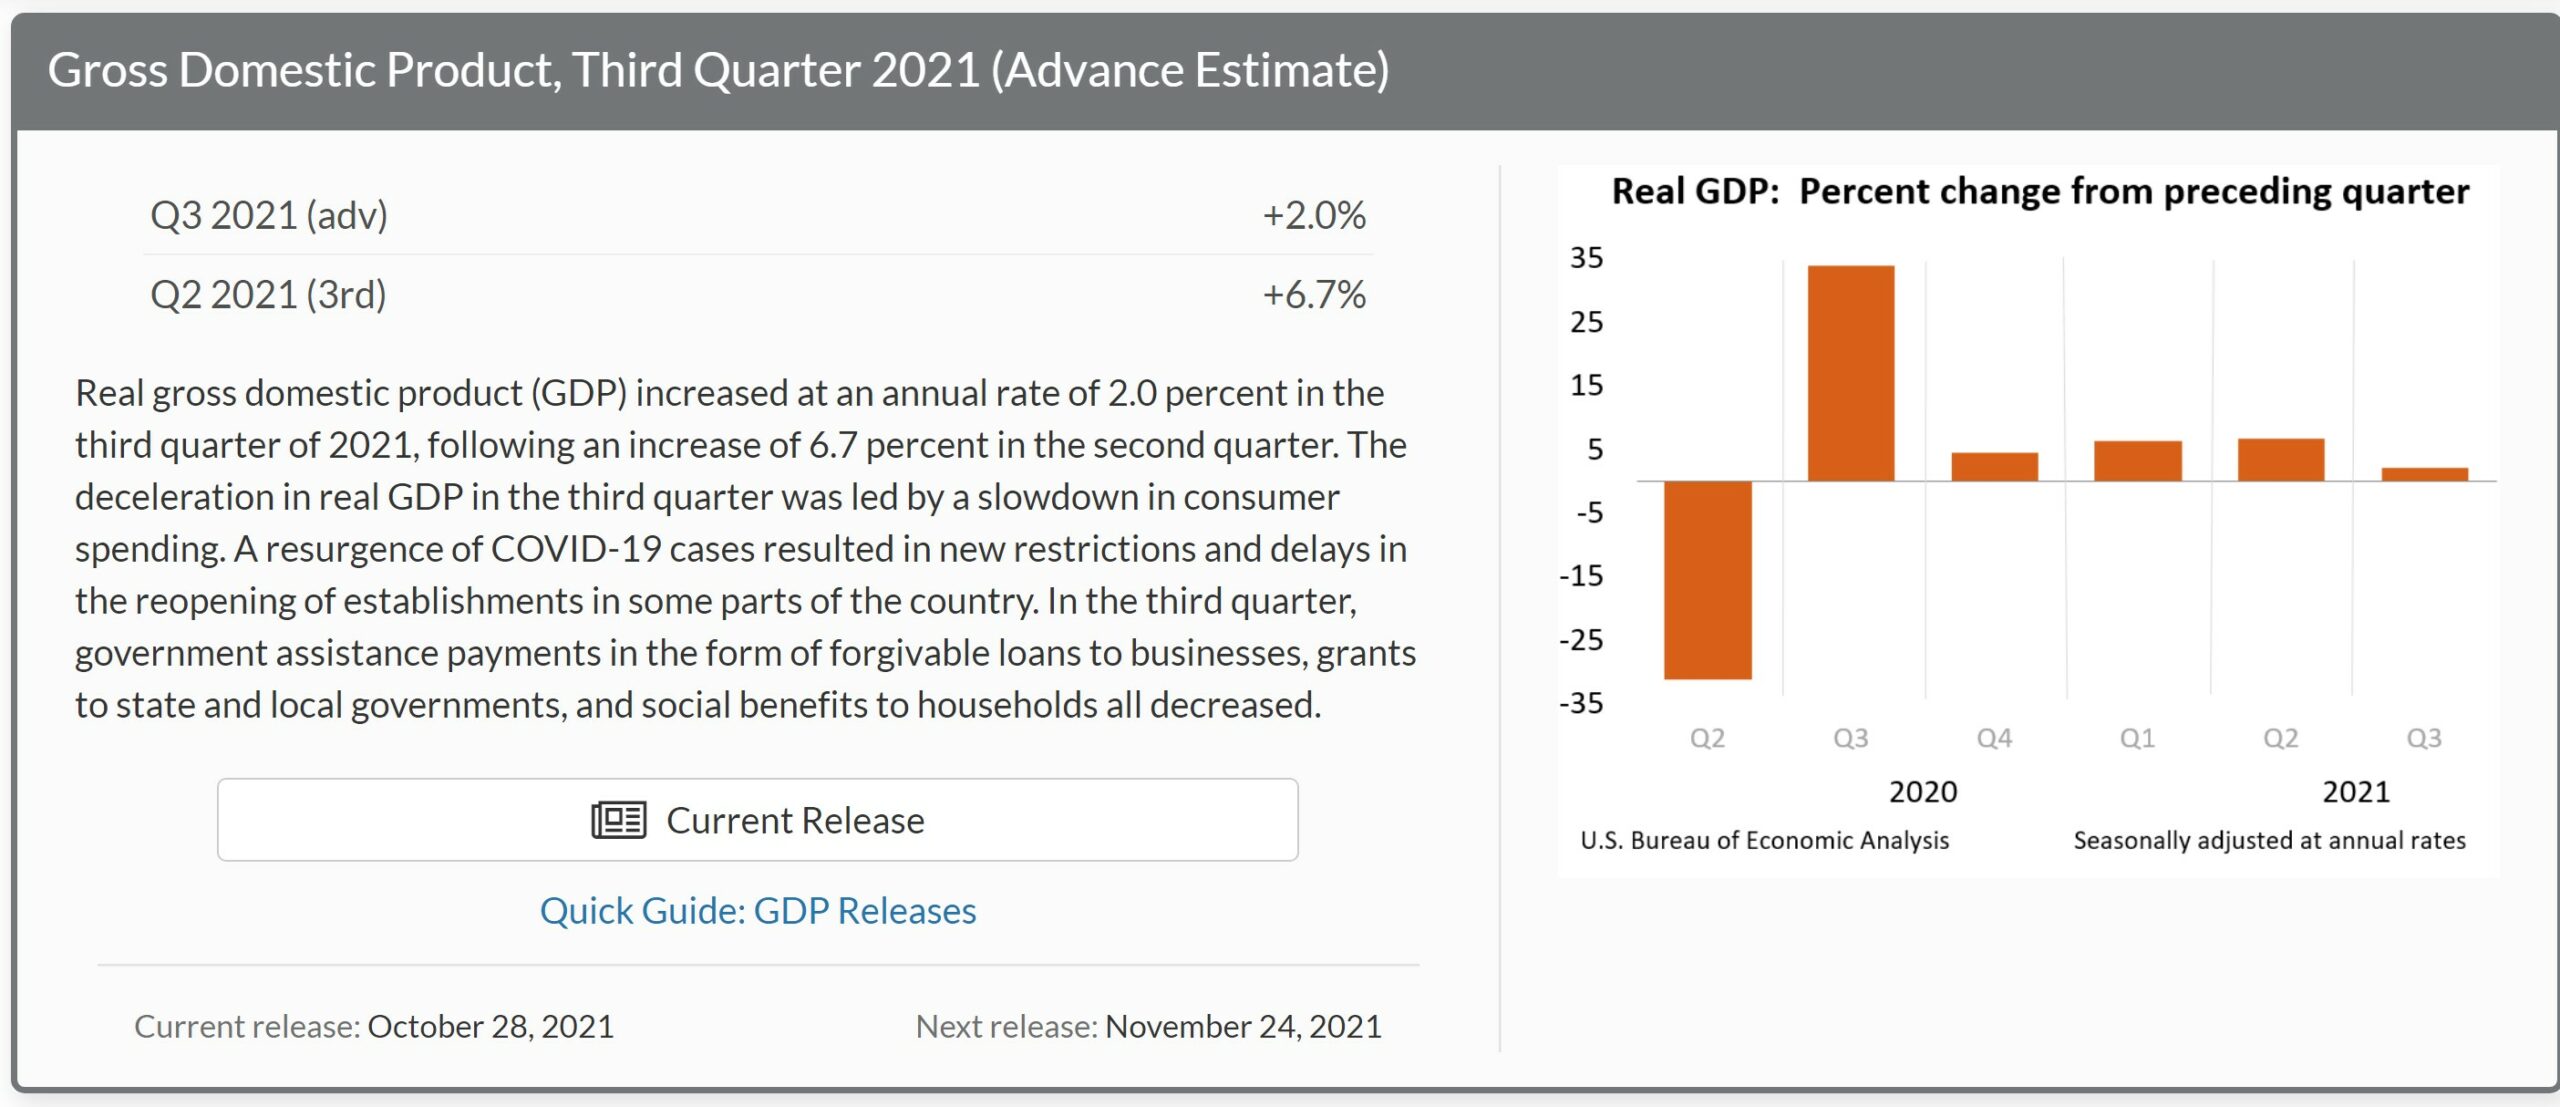
Our economy grew at a 2.0% rate in the 3rd quarter, quite a bit slower than the growth rate of the second quarter, as increasing consumer outlays for services, greater nonresidential fixed investment, and inventory improvement were offset by decreasing consumer outlays for durable goods, shrinking residential investment, lower exports, and greater imports, which subtracts from other GDP components . . . the Advance Estimate of 3rd Quarter GDP from the Bureau of Economic Analysis estimated that the real output of goods and services produced in the US grew at a 2.0% annual rate over the output of the 2nd quarter, when our real output grew at a 6.7% real rate . . . in current dollars, our third quarter GDP grew at a 7.83% annual rate, increasing from what would work out to be a $22,741.0 billion a year output rate in the 2nd quarter to a $23,173.5 billion annual rate in the 3rd quarter, with the headline 2.0% annualized rate of increase in real output arrived at after annualized GDP inflation adjustments averaging 5.7% were computed from the price changes of the components and applied to their current dollar change…. as is usual with an advance estimate, the BEA cautions that the source data is incomplete and also subject to revisions, which have averaged +/-0.6% in either direction before the third estimate for the quarter is released, which will be two months from now . . . also note that September construction and factory inventory data were not yet reported at the time of this release, and that the BEA assumed a $6.1 billion decrease in residential construction, a $2.1 billion decrease in nonresidential construction, and a $2.2 billion increase in nondurable manufacturing inventories for September before they estimated the 3rd quarter’s output (see Key source data and assumptions (xls) for more details)
While we review the details for the 3rd quarter below, remember that the news release for GDP reports all quarter over quarter percentage changes at an annual rate, which means that they’re expressed as a change a bit over 4 times of that what actually occurred over the 3 month period, and that the prefix “real” is used to indicate that each change has been adjusted for inflation using price indexes chained from 2012 prices, and then that all percentage changes in this report are calculated from those ‘2012 dollar’ figures, which would be better thought of as a quantity indexes than as any reality based dollar amounts….for our purposes, all the data that we’ll use in reporting the changes here comes directly from the pdf for the 1st estimate of 3rd quarter GDP, which we find on the BEA GDP landing page, which also offer links to just the tables on Excel and other technical notes . . . specifically, we refer to table 1, which shows the real percentage change in each of the GDP components annually and quarterly since the 4th quarter of 2017, table 2, which shows the contribution of each of the components to the GDP figures for those quarters and years; table 3, which shows both the current dollar value and inflation adjusted value of each of the GDP components; and table 4, which shows the change in the price indexes for each of the GDP components…
Personal consumption expenditures (PCE), which accounts for roughly 70% of GDP, grew at a 6.92% rate in current dollars in the 3rd quarter, which worked out to a rounded 1.6% real growth rate of consumed goods and services after the 3rd quarter’s annualized 5.3% PCE price index increase was computed and used to adjust that personal spending for inflation….consumer outlays for durable goods fell at a 6.5% rate, while average prices of those durable goods rose at an 9.6% rate, and from those changes the BEA figured that the real growth of the output of consumer durables fell at a 26.2% rate, as real consumption of motor vehicles and parts shrunk at a 44.1% annual rate and accounted for more than 70% of the decrease in durable goods . . . the BEA also found that real output of consumer non-durable goods increased at a 2.6% rate, after growth in consumer spending for non-durables at a 8.7% rate was adjusted for prices that rose at an average 5.9% rate, as a 44.0% real growth rate in consumption of gasoline and other fuels accounted for more than half of the growth in non-durables . . . meanwhile, the quarter’s 12.63% nominal growth rate in consumer outlays for services was deflated by a 4.2% increase in prices for personal services to show real output of consumer services grew at a 7.9% annual rate, as real transportation services grew at a 41.6% rate and accounted for more growth than health care or foods services among the quarter’s broad based growth in services…as a result of those changes in growth from the 2nd to the 3rd quarter, the decrease in outlays for durable goods subtracted 2.70 percentage points from the GDP growth rate, while increased consumption of non-durable goods added 0.39 percentage points, and increased consumption of services added 3.40 percentage points to the growth rate of GDP in the 3rd quarter…
The change in other components of the change in GDP are computed by the BEA in the same manner as we have just illustrated for computing PCE; ie, the annualized change in current dollar spending for the quarter is adjusted with the annualized inflation factor for that component, yielding the change in real units of goods or services produced during the quarter, also at an annual rate . . . thus, real gross private domestic investment, which had shrunk at a 3.9% annual rate in the 2nd quarter, grew at a 11.7% annual rate from those levels in the 3rd quarter, even though real growth in fixed investments shrunk at a 0.8% annual rate in the 3rd quarter after growing at a 3.3% rate in the 2nd quarter, because the 2nd quarter’s large inventory shrinkage was partially ameliorated . . . among fixed investment categories, real nonresidential fixed investment grew at a 1.8% rate, even though real investment in non-residential structures shrunk at a 7.3% rate and subtracted 0.19 percentage points from 3rd quarter GDP and real investment in equipment shrunk at 3.2% rate and subtracted 0.18 percentage points from GDP, because real investment in intellectual property grew at a 12.2% rate and added 0.61 percentage points to GDP . . . however, real residential investment shrunk at a 7.7% rate in the 3rd quarter, after shrinking at a 11.7% rate in the 2nd quarter, and subtracted 0.38 percentage points from 3rd quarter GDP, and thus turned the fixed investment component negative….for an easy to read table as to what’s included in each of those GDP investment categories, see the NIPA Handbook, Chapter 6, page 3.
Meanwhile, a smaller shrinkage of private inventories in the 3rd quarter increased gross investment and hence GDP, as real private inventories fell by an inflation adjusted $77.7 billion in the quarter, down from the $168.5 billion of inflation adjusted inventory shrinkage reported for the second quarter, and as a result the $90.9 billion relative increase in real inventory growth added 2.07 percentage points to the 3rd quarter’s growth rate, after an inflation adjusted $80.2 billion decrease in real inventory growth in the 2nd quarter had subtracted 1.26 percentage points from that quarter’s GDP growth rate…however, a smaller shrinkage in inventories indicates that relatively more of the goods produced during the quarter were left sitting in a warehouse or on a shelf, so their quarter over quarter increase by $90.8 billion meant that real final sales of GDP were relatively smaller by that much, and hence real final sales of GDP shrunk at a 0.1% rate in the 2nd quarter, after real final sales had increased at a 9.1% rate in the 2nd quarter, when the larger decrease in inventories meant that real final sales of GDP were that much higher…
Nominal exports and real imports both increased in the quarter, but after adjustment for 9.5% higher export prices and 5.9% higher import prices, real exports shrank while real imports grew, thus decreasing the amount of our investment and consumption that was domestically sourced…our real exports of goods and services decreased at a 2.5% rate in the third quarter, after our exports had increased at a 7.6% rate in the 2nd quarter, while our real imports grew at a 6.1% rate in the 3rd quarter after growing at a 7.1% rate in the 2nd quarter . . . as you’ll recall, increases in exports are added to GDP because they are part of our production that was not consumed or added to investment in our country (& hence not counted elsewhere in this GDP calculation), while increases in imports subtract from GDP because they represent either consumption or investment that was added to another GDP component that shouldn’t have been because it was not produced in the US….thus the 3rd quarter decrease in real exports conversely subtracted 0.28 percentage points from 3rd quarter GDP, while the increase in 3rd quarter imports subtracted 0.87 percentage points from 3rd quarter GDP, and hence our worsening trade imbalance subtracted a net 1.14 percentage points from 3rd quarter GDP, after a smaller increase in our trade deficit in the second quarter had subtracted 0.18 percentage points from that quarter’s GDP…
Finally, real consumption and investment by the government sector increased at a 0.8% annual rate in the 3rd quarter, after shrinking at a 2.0% rate in the 2nd quarter, as real federal government consumption and investment shrunk at a 4.7% rate while real state and local consumption and investment grew at a 4.4% rate. Inflation adjusted federal spending for defense shrunk at a 1.4% rate and that subtracted 0.06 percentage points from 3rd quarter GDP growth, while real non-defense federal consumption and investment shrunk at a 9.2% rate and subtracted 0.27 more percentage points from GDP. Note that federal government outlays for social insurance are not included in this GDP component; rather, they are included within personal consumption expenditures only when such funds are spent on goods or services, indicating an increase in the output of those goods or services. Meanwhile, real state and local government investment and consumption expenditures, which grew at a 4.4% annual rate, added 0.46 percentage points to the quarter’s growth rate, even after a decrease in real state and local investment at a 6.5% rate subtracted 0.13 percentage points from the state and local increase…