MONTHLY CONSTRUCTION SPENDING, APRIL 2021, June 1, 2021Angry Bear Commenter RJS blogs at MarketWatch 666 and presents current economic market information. Estimates the impact of the February and March revisions on the 1st quarter GDP and is estimating the impact of this April report on 2nd quarter GDP (see below past Census reports. ___________________ The Census Bureau’s report on construction spending for April (pdf) estimated that the month’s seasonally adjusted construction spending was at a ,524.2 billion annual rate during the month, up 0.2 percent (±0.8 percent) from the revised March annual sales rate of ,521.0 billion, and 9.8 percent (±1.2 percent) above the estimated annualized level of construction spending in April of last
Topics:
run75441 considers the following as important: MarketWatch 666, politics, RJS, US EConomics
This could be interesting, too:
Robert Skidelsky writes Lord Skidelsky to ask His Majesty’s Government what is their policy with regard to the Ukraine war following the new policy of the government of the United States of America.
NewDealdemocrat writes JOLTS revisions from Yesterday’s Report
Joel Eissenberg writes No Invading Allies Act
Ken Melvin writes A Developed Taste
Angry Bear Commenter RJS blogs at MarketWatch 666 and presents current economic market information. Estimates the impact of the February and March revisions on the 1st quarter GDP and is estimating the impact of this April report on 2nd quarter GDP (see below past Census reports.
___________________
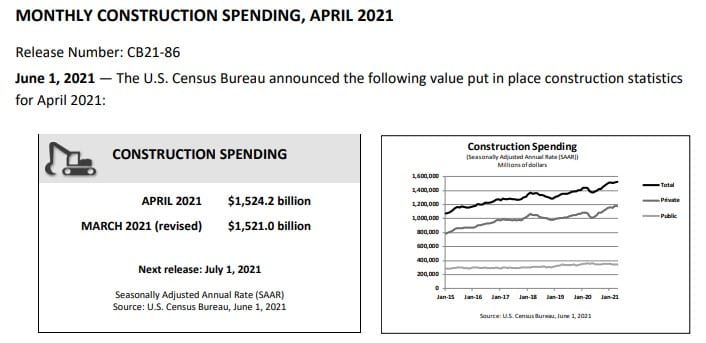
The Census Bureau’s report on construction spending for April (pdf) estimated that the month’s seasonally adjusted construction spending was at a $1,524.2 billion annual rate during the month, up 0.2 percent (±0.8 percent) from the revised March annual sales rate of $1,521.0 billion, and 9.8 percent (±1.2 percent) above the estimated annualized level of construction spending in April of last year…the annualized March construction spending estimate was revised 0.5% higher, from $1,513.1 billion to $1,521.0 billion, while the annual rate of construction spending for February was revised 0.2% lower, from $1,509.9 billion to $1,506.64 billion…taken together, those revisions would suggest an upward revision of $2.1 billion to first quarter construction spending on a annualized basis, which would in turn add around 0.05 or 0.06 percentage points to 1st quarter GDP when the third estimate is released at the end of June…
A further breakdown of the different subsets of construction spending is provided in a Census summary, which precedes the detailed spreadsheets:
- Private Construction: Spending on private construction was at a seasonally adjusted annual rate of $1,180.7 billion, 0.4 percent (±0.7 percent)* above the revised March estimate of $1,175.4 billion. Residential construction was at a seasonally adjusted annual rate of $729.2 billion in April, 1.0 percent (±1.3 percent)* above the revised March estimate of $721.8 billion. Nonresidential construction was at a seasonally adjusted annual rate of $451.4 billion in April, 0.5 percent (±0.7 percent)* below the revised March estimate of $453.7 billion.
- Public Construction: In April, the estimated seasonally adjusted annual rate of public construction spending was $343.5 billion, 0.6 percent (±1.6 percent)* below the revised March estimate of $345.6 billion. Educational construction was at a seasonally adjusted annual rate of $84.8 billion, 0.5 percent (±1.8 percent)* below the revised March estimate of $85.2 billion. Highway construction was at a seasonally adjusted annual rate of $99.8 billion, 0.6 percent (±5.6 percent)* above the revised March estimate of $99.2 billion.
This construction spending report is used as source data for 3 subcomponents of GDP; investment in private non-residential structures, investment in residential structures, and as government investment outlays, for both state and local and Federal governments…however, getting an accurate read on the impact of April’s construction spending reported in this release on 2nd quarter GDP is difficult because all figures given here are in nominal dollars and as you know, data used to compute the change in GDP must be adjusted for changes in price…there are many different price indexes for different types of construction listed in the National Income and Product Accounts Handbook, Chapter 6 (pdf) that are used by the BEA to make those inflation adjustments, so in lieu of trying to adjust for price changes for all of those types of construction separately the way the BEA will do, we’ve opted to just use the producer price index for final demand construction as an inexact shortcut to make the price adjustment needed for an estimate…that index showed that aggregate construction costs were up 1.1% from March to April, up 0.5% from February to March and up 0.3% from January to February….
On that basis, we can estimate that April construction costs were roughly 1.6% greater than those of February and at least 1.9% greater than those of January, and obviously 1.1% greater than those of March….we then use those percentage differences to inflate spending for each of those three months, which is arithmetically the same as deflating April construction spending against the first quarter, for comparison purposes….annualized construction spending in millions of dollars for the first quarter months is given as 1,521,014 for March, 1,506,639 for February, and 1,518,707 for January….thus to find the difference between April’s inflation adjusted construction spending and the inflation adjusted construction spending of the first quarter, our formula becomes: 1,524,183 / (( 1,521,014 * 1.011 + 1,506,639 * 1.016 + 1,518,707 * 1.019) / 3) = 0.9906, meaning real construction spending in April was down roughly 0.94% vis a vis the 1st quarter, or down at a 3.72% annual rate….to figure the potential effect of that change on 2nd quarter GDP, we take the annualized difference between the first quarter average inflation adjusted construction spending and April’s spending as a fraction of the annualized 1st quarter GDP figure, and from that estimate that real April construction spending was falling at a rate that would subtract about 0.35 percentage points from the growth rate of 2nd quarter GDP, in the unlikely event that May and June’s inflation adjusted construction is little changed from that of April…