Construction Spending Rose 0.2% in October after Prior Months Were Much Revised Higher, MarketWatch 666, RJS The Census Bureau’s report on construction spending for October (pdf) estimated that the month’s seasonally adjusted construction spending would work out to ,598.0 billion annually if extrapolated over an entire year, which was 0.2 percent (+/-1.2 percent)* above the revised September estimated annual rate of ,594.8 billion and 8.6 percent (±1.3 percent) above the estimated annual rate of construction spending in October of last year…for the first ten months of this year, construction spending amounted to ,323.1 billion, which was 7.5 percent (±1.0 percent) above the ,230.8 billion spent on construction over the same
Topics:
run75441 considers the following as important: Hot Topics, MarketWatch 666, RJS, US EConomics
This could be interesting, too:
NewDealdemocrat writes JOLTS revisions from Yesterday’s Report
Joel Eissenberg writes No Invading Allies Act
Bill Haskell writes The North American Automobile Industry Waits for Trump and the Gov. to Act
Bill Haskell writes Families Struggle Paying for Child Care While Working
Construction Spending Rose 0.2% in October after Prior Months Were Much Revised Higher, MarketWatch 666, RJS
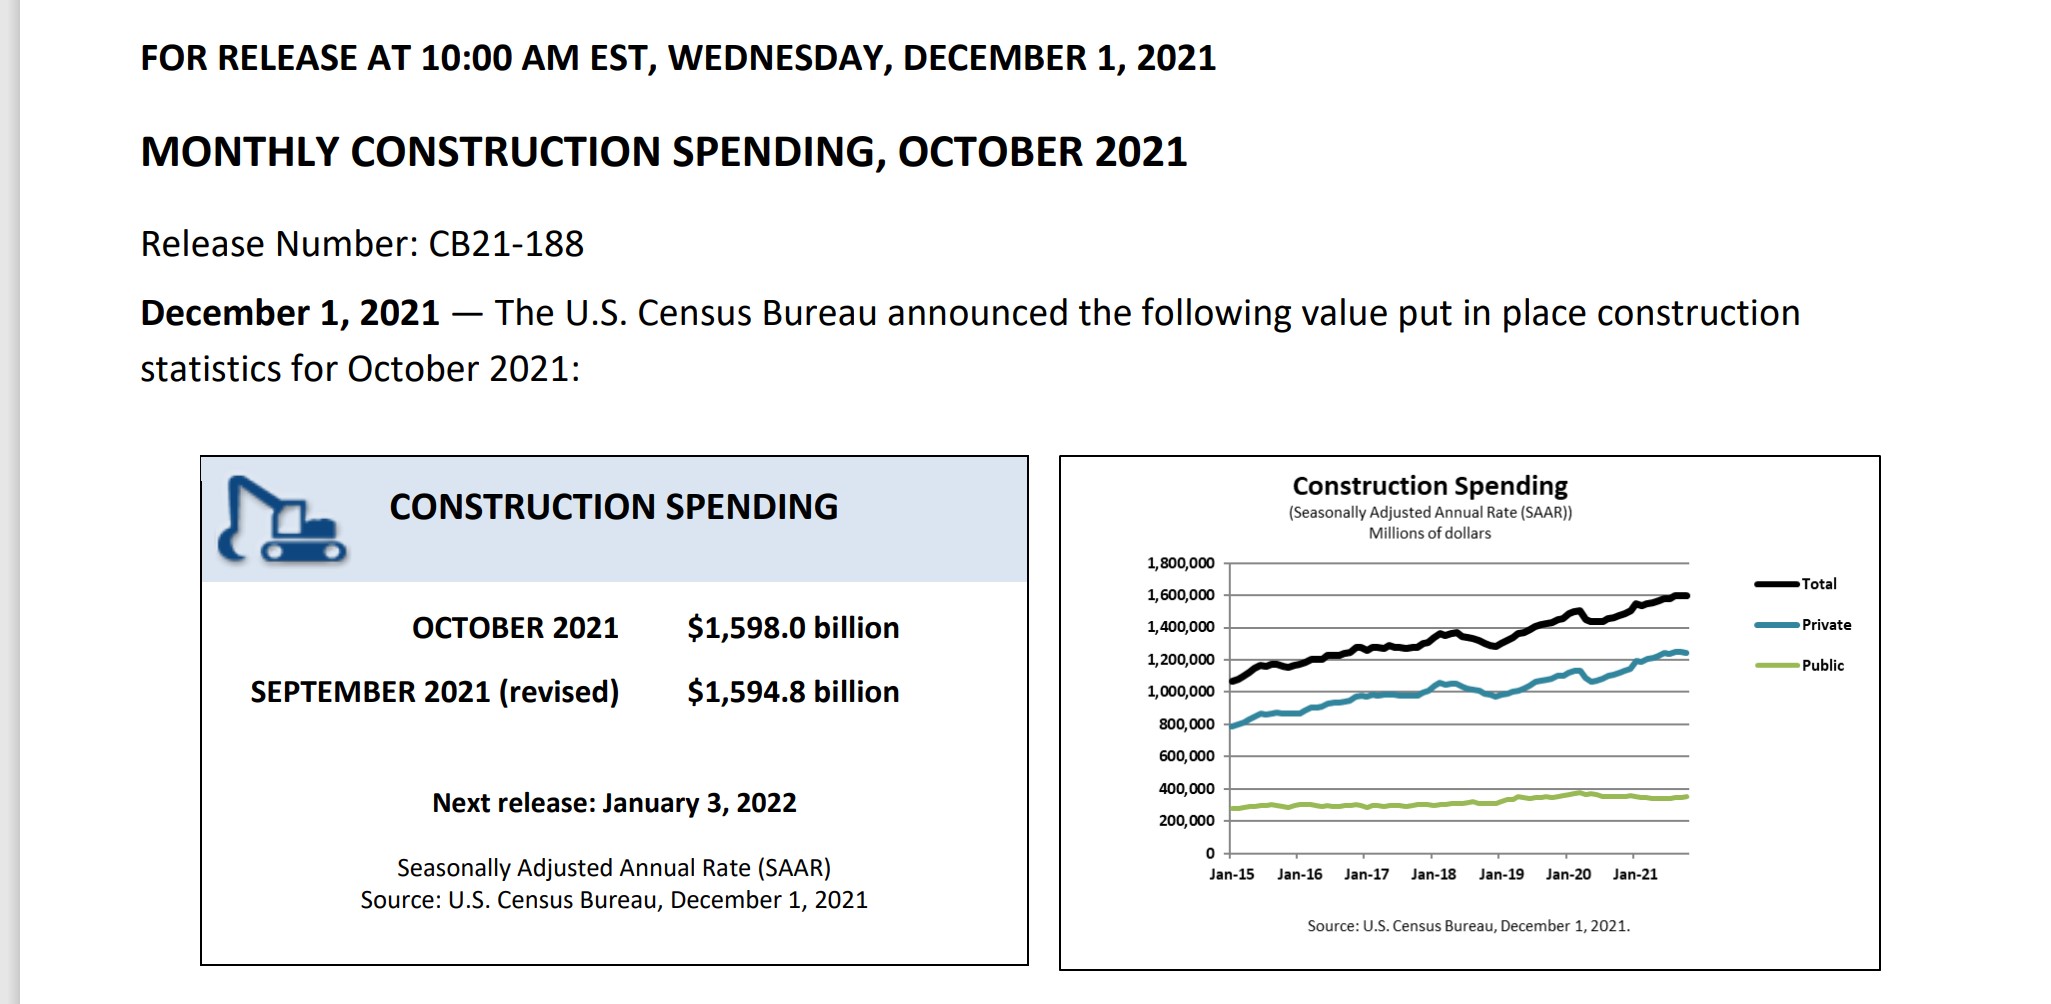
The Census Bureau’s report on construction spending for October (pdf) estimated that the month’s seasonally adjusted construction spending would work out to $1,598.0 billion annually if extrapolated over an entire year, which was 0.2 percent (+/-1.2 percent)* above the revised September estimated annual rate of $1,594.8 billion and 8.6 percent (±1.3 percent) above the estimated annual rate of construction spending in October of last year…for the first ten months of this year, construction spending amounted to $1,323.1 billion, which was 7.5 percent (±1.0 percent) above the $1,230.8 billion spent on construction over the same period in 2020…
The annualized September construction spending estimate was revised more than 1.3% higher with this release, from $1,573.6 billion to $1,594.8 billion, while the annual rate of construction spending for August was revised more than 0.9% higher, from $1,582.0 billion to $1,596,8 billion. The combined upward revisions of $36.0 billion to annualized August and September construction spending figures would be averaged over the 3 months of the quarter and increase the annualized 3rd quarter construction figures by around $12.0 billion, before any inflation adjustment, which would thus suggest an upward revision of about 0.28 percentage points to the relevant components of third quarter GDP when the third estimate is released on December 22nd…
A further breakdown of the different subsets of construction spending is provided in a Census summary, which precedes the detailed spreadsheets:
- Private Construction: Spending on private construction was at a seasonally adjusted annual rate of $1,245.0 billion, 0.2 percent (±0.7 percent)* below the revised September estimate of $1,247.9 billion. Residential construction was at a seasonally adjusted annual rate of $774.7 billion in October, 0.5 percent (±1.3 percent)* below the revised September estimate of $778.6 billion. Nonresidential construction was at a seasonally adjusted annual rate of $470.3 billion in October, 0.2 percent (±0.7 percent)* above the revised September estimate of $469.4 billion.
- Public Construction: In October, the estimated seasonally adjusted annual rate of public construction spending was $353.0 billion, 1.8 percent (±2.0 percent)* above the revised September estimate of $346.8 billion. Educational construction was at a seasonally adjusted annual rate of $82.2 billion, 0.2 percent (±2.0 percent)* above the revised September estimate of $82.0 billion. Highway construction was at a seasonally adjusted annual rate of $102.5 billion, 2.4 percent (±4.9 percent)* above the revised September estimate of $100.1 billion.
As you can tell from the above, the construction spending reported here would be included in 3 subcomponents of GDP; investment in private non-residential structures, investment in residential structures, and into government investment outlays, for both state and local and Federal governments…however, getting an accurate read on the impact of October spending reported in this release on 4th quarter GDP is difficult because all figures given here are in nominal dollars and as you know, data used to compute the change in GDP must be adjusted for changes in price….but accurately adjusting construction spending for price changes is no easy matter, because the National Income and Product Accounts Handbook, Chapter 6, lists a multitude of privately published deflators that are used by the BEA for the various components of non-residential investment, ie, such as using the Handy-Whitman construction cost indexes for electric light and power plants and for utility building…in lieu of trying to find and adjust for all of the obscure price indices the BEA uses separately, we’ve opted to use the producer price index for final demand construction as an inexact shortcut in an attempt to make a reasonable price adjustment on the total.. That index showed that aggregate construction costs were up 6.6% month over month in October, after increasing 0.2% in August and 0.1% in September…
On that basis, we could estimate that October’s construction costs were roughly 6.9% more than those of July, 6.7% more than those of August, and obviously 6.6% more than those of September. We’ll then use those percentage changes to inflate the lower cost spending figures for those months, which is arithmetically the same as deflating higher cost October construction spending, for purposes of comparison. Annualized construction spending in millions of dollars for the third quarter months is given as $1,594,756 in September, $1,596,816 in August, and $1,581,128 in July. Thus to adjust October’s nominal construction spending of $1,598,020 million for inflation in order to compare it to that of the third quarter, our arithmetic formula would be: 1,598,020 / (((1,594,756 * 1.066 ) + (1,596,816 * 1.067) + (1,581,128 * 1.069)) / 3) = 0.94111, meaning real construction in October averaged 5.89% lower than that of the 3rd quarter, or that it fell at a 21.56% annual rate. To figure the effect of that change on GDP, we figure the difference between the third quarter inflation adjusted average and that of October and take the annualized result of that as a fraction of the inflation adjusted 3rd quarter GDP figure, and find that real October construction spending is falling at a rate that would subtract about 2.20 percentage points from 4th quarter GDP, assuming hypothetically that there would be no change in real construction over the next two months….NB: note that we have a very low confidence in that estimate this time around, given that it is almost completely due to the 6.6% increase in the producer price index for final demand construction, which might be quite different than the indices that the BEA will use to compute real construction for October when they figure 4th quarter GDP at the end of January..