Oil exports drop by the most on record to least since October 2018; global oil shortage at 1.73 million barrels per day, Focus on Fracking, RJS The “global oil shortage” is from my coverage of the May OPEC report, which i’ll paste below; I also revise global oil shortage/surplus estimates for prior months. I don’t know of anyone else who digs this stuff out of this report (a 100 page report is more than most journos can handle)… OPEC’s Monthly Oil Market Report Tuesday of this past week saw the release of OPEC’s May Oil Market Report, which covers OPEC & global oil data for April, and hence it gives us a picture of the global oil supply & demand situation for the 4th month after OPEC, the Russians, and other oil producers agreed to increase
Topics:
run75441 considers the following as important: Focus on Fracking, politics, RJS, US/Global Economics
This could be interesting, too:
Robert Skidelsky writes Lord Skidelsky to ask His Majesty’s Government what is their policy with regard to the Ukraine war following the new policy of the government of the United States of America.
Joel Eissenberg writes No Invading Allies Act
Ken Melvin writes A Developed Taste
Bill Haskell writes The North American Automobile Industry Waits for Trump and the Gov. to Act
Oil exports drop by the most on record to least since October 2018; global oil shortage at 1.73 million barrels per day, Focus on Fracking, RJS
The “global oil shortage” is from my coverage of the May OPEC report, which i’ll paste below; I also revise global oil shortage/surplus estimates for prior months. I don’t know of anyone else who digs this stuff out of this report (a 100 page report is more than most journos can handle)…
OPEC’s Monthly Oil Market Report
Tuesday of this past week saw the release of OPEC’s May Oil Market Report, which covers OPEC & global oil data for April, and hence it gives us a picture of the global oil supply & demand situation for the 4th month after OPEC, the Russians, and other oil producers agreed to increase their oil production by 500,000 barrels per day starting January, from their prior 2020 commitment to cut production by 7.7 million barrels a day from an October 2018 peak, which had been earlier reduced from the 9.7 million barrels a day cuts they had imposed on themselves during May, June and July of 2020, and after the Saudis unilaterally committed to further cut their own production by a million barrels per day during February, March, and then later during April of this year…before we start, we want to again caution that the oil demand estimates made herein, while the course of the Covid-19 pandemic still remains uncertain, should be considered as having a much larger margin of error than we’d expect from this report during stable and hence more predictable periods..
The first table from this monthly report that we’ll check is from the page numbered 50 of this month’s report (pdf page 60), and it shows oil production in thousands of barrels per day for each of the current OPEC members over the recent years, quarters and months, as the column headings below indicate…for all their official production measurements, OPEC uses an average of estimates from six “secondary sources”, namely the International Energy Agency (IEA), the oil-pricing agencies Platts and Argus, the U.S. Energy Information Administration (EIA), the oil consultancy Cambridge Energy Research Associates (CERA) and the industry newsletter Petroleum Intelligence Weekly, as a means of impartially adjudicating whether their output quotas and production cuts are being met, to thereby avert any potential disputes that could arise if each member reported their own figures…

As we can see from the above table of their oil production data, OPEC’s oil output increased by a rounded 26,000 barrels per day to 25,083,000 barrels per day during April, up from their revised March production total of 25,057,000 barrels per day…however, that March output figure was originally reported as 25,042,000 barrels per day, which therefore means that OPEC’s March production was revised 15,000 barrels per day higher with this report, and hence OPEC’s March production was, in effect, a 41,000 barrel per day increase from the previously reported OPEC production figure (for your reference, here is the table of the official March OPEC output figures as reported a month ago, before this month’s revision)…
From the same table, we can see that an increase of 75,000 barrels per day in Nigeria’s output, a 73,000 barrels per day increase in Iran’s production, and a production increase of 34,000 barrels per day from the Saudis were the major factors in OPEC’s March output increase; , and that those increases we mostly offset by a decrease of 81,000 barrels per day in the output from Venezuela and a decrease of 67,000 barrels per day in the output from Libya, coincidentally two of the countries that have remained exempt from any of the quotas imposed on other members by these output cuts….recall that last year’s original oil producer’s agreement was to cut production by 9.7 million barrels per day from an October 2018 baseline for just two months early in the pandemic, during May and June, but that agreement had been extended to include July at a meeting between OPEC and other producers on June 6th….then, in a subsequent meeting in July, OPEC and the other oil producers agreed to ease their deep supply cuts by 2 million barrels per day to 7.7 million barrels per day for August and subsequent months, which was thus the agreement that covered OPEC’s output for the rest of 2020…the OPEC+ agreement for January’s production, which was later extended to include February and March and then April’s output, was to further ease their supply cuts by 500,000 barrels per day to 7.2 million barrels per day from that original baseline…however, war torn Libya and US sanctioned OPEC members Iran and Venezuela have been exempt from the production cuts imposed by these agreements, and as we can see above, they all had significant production changes this month…
For those OPEC members that do fall under the output quotas imposed by that series of revised agreements, we have below a table of the output levels they were “voluntarily” required to adhere to in April, reflecting the extension of the production levels designated for March through the month of April:

The above table was provided as a downloadable attachment to the press release following the press release following the 13th OPEC and non-OPEC Ministerial Meeting on January 5th of this year, and it includes the reference production and expected production levels for the 10 members of OPEC that are expected to make cuts and for the other major oil producers who are party to what the press calls the “OPEC + agreement”….the first column in the above table shows the reference oil production baseline, in thousands of barrel per day, from which each of the oil producers was to cut from, a figure which is based on each of the producer’s October 2018 oil output, ie., a date before last year’s and the prior year’s output cuts took effect, and coincidently the highest monthly production of the era for most of the producers who are party to these cuts…the remaining columns show the adjustment, or cut, from that reference production level and then the oil output allowed for each producer under the agreement for the months of January, February and March, which were extended to include April at the March level at the 14th OPEC and non-OPEC Ministerial Meeting on March 4th…OPEC arrived at these figures by adjusting the 23% cut from the October 2018 baseline originally agreed to for May and June 2020 for subsequent agreements to “ease” that 23% cut by agreed to fractions, and it applied to all participants except for Mexico, who already had their oil production hedged to profit from lower prices…the OPEC member output quota is identical for each of the three months covered above; however, the ongoing agreements from the OPEC and non-OPEC Ministerial Meetings have subsequently allowed Russia and Kazakhstan to incrementally increase their oil output over February and March to meet seasonal increases in domestic demand, and again in April at the March 4th meeting cited above….in April, both Iraq, with an oil output of 3,920,000 barrels per day, and Nigeria, with an output of 1,548,000 barrels per day, were producing more than their quota, but that excess output was more than covered by the Saudis unilaterally keeping their production a million barrels per day below their quota…
The next graphic from this month’s report that we’ll highlight shows us both OPEC and world oil production monthly on the same graph, over the period from May 2019 to April 2021, and it comes from page 51 (pdf page 61) of OPEC’s April Monthly Oil Market Report….on this graph, the cerulean blue bars represent OPEC’s monthly oil production in millions of barrels per day as shown on the left scale, while the purple graph represents global oil production in millions of barrels per day, with the metrics for global output shown on the right scale….
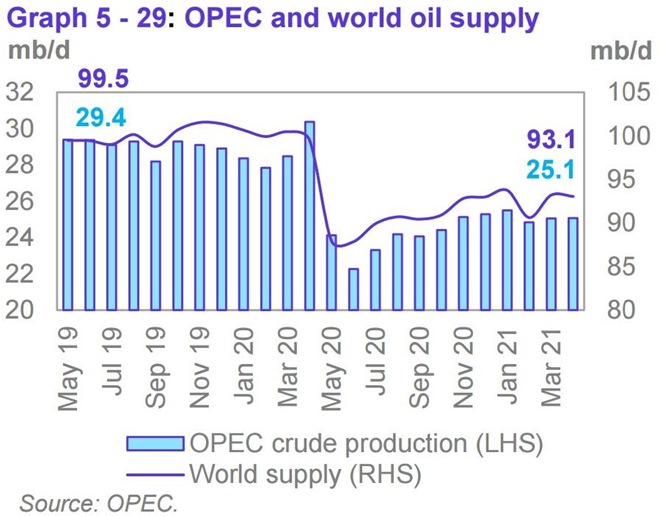
After this month’s reported 26,000 barrel per day increase in OPEC’s production from what they produced a month earlier, OPEC’s preliminary estimate indicates that total global liquids production decreased by a rounded 150,000 barrels per day to average 93.06 million barrels per day in April, a reported decrease which apparently came after March’s total global output figure was revised down by 20,000 barrels per day from the 93.23 million barrels per day of global oil output that was reported for March a month ago, as non-OPEC oil production fell by a rounded 180,000 barrels per day in March after that revision, with a decrease of 500,000 barrels per day, due to planned maintenance, in the oil output from Canada and Norway accounting for the non-OPEC production decrease in April…
After that decrease in April’s global output, the 93.06 million barrels of oil per day that were produced globally in April were still 6.45 million barrels per day, or 6.5% less than the revised 99.51 million barrels of oil per day that were being produced globally in April a year ago, which was the month that the first Saudi-Russian agreement to cut production to support prices broke down, resulting in oil prices briefly falling below zero (see the May 2020 OPEC report (online pdf) for the originally reported April 2020 details)…with this month’s modest increase in OPEC’s output, their April oil production of 25,083,000 barrels per day was at 27.0% of what was produced globally during the month, an increase of 0.1% from their revised 26.9% share of the global total in February….OPEC’s April 2020 production was reported at 30,412 barrels per day, which means that the 13 OPEC members who were part of OPEC last year produced 5,329,000, or 17.5% fewer barrels per day of oil this April than what they produced a year earlier, when they accounted for 30.6% of global output…
After the modest decrease in global oil output that we’ve seen in this report, the amount of oil being produced globally during the month again fell short of the expected demand, as this next table from the OPEC report will show us…

The above table came from page 29 of the OPEC May Oil Market Report (pdf page 39), and it shows regional and total oil demand estimates in millions of barrels per day for 2020 in the first column, and OPEC’s estimate of oil demand by region and globally quarterly over 2021 over the rest of the table…on the “Total world” line in the third column, we’ve circled in blue the figure that’s relevant for April, which is their estimate of global oil demand during the second quarter of 2021… OPEC is estimating that during the 2nd quarter of this year, all oil consuming regions of the globe will be using an average of 94.79 million barrels of oil per day, which is a rounded 300,000 barrels per day downward revision from the 95.09 million barrels of oil per day of demand they were estimating for the second quarter a month ago (note that we have encircled this month’s revisions in green), which still reflects quite a bit of coronavirus related demand destruction compared to 2019, when global demand averaged 99.98 million barrels per day….but as OPEC showed us in the oil supply section of this report and the summary supply graph above, OPEC and the rest of the world’s oil producers were only producing 93.06 million barrels million barrels per day during April, which would imply that there was a shortage of around 1,730,000 barrels per day in global oil production in April when compared to the demand estimated for the month…
Note that in green we have also circled a downward revision of 140,000 barrels per day to OPEC’s previous estimates of first quarter demand…for March, that means that that the 200,000 barrels per day global oil output shortage we had previously figured for March would be revised to a shortage of just 80,000 barrels per day, after the downward revision of 20,000 barrels per day to March’s global oil output that’s implied in this report is also taken into account… similarly, the downward revision to first quarter demand means that the 1,430,000 barrels per day global oil output shortage we had previously figured for February would now be revised to a shortage of 1,290,000 barrels per day, and that the 210,000 barrels per day global oil output shortage we had previously figured for January would be revised to a shortage of 70,000 barrels per day, in light of the 140,000 barrel per day downward revision to first quarter demand…note, however, that despite this year’s output shortfalls, the quantities of oil produced globally in 2020 still averaged well over 3 million barrels per day more than anyone wanted…