Oil prices at 7 year high after longest string of weekly gains on record, Focus on Fracking, Commenter and Blogger RJS Oil prices rose for a record 9th consecutive week to a fresh 7 year high following across the board withdrawals from US oil & product inventories . . . after rising 3.7% to a 7 year high of .28 a barrel last week as global shortages of coal and natural gas were expected to lead to increased demand for oil, the contract price for US light sweet crude for November delivery opened higher on Monday as oil traders looked to easing of pandemic restrictions and a colder winter to boost demand, but eased off of multiyear highs to settle just 16 cents higher at .44 a barrel, after data showed US industrial production unexpectedly
Topics:
run75441 considers the following as important: energy policy, Focus on Fracking, Oil, politics, RJS, US/Global Economics
This could be interesting, too:
Robert Skidelsky writes Lord Skidelsky to ask His Majesty’s Government what is their policy with regard to the Ukraine war following the new policy of the government of the United States of America.
Joel Eissenberg writes No Invading Allies Act
Ken Melvin writes A Developed Taste
Bill Haskell writes The North American Automobile Industry Waits for Trump and the Gov. to Act
Oil prices at 7 year high after longest string of weekly gains on record, Focus on Fracking, Commenter and Blogger RJS
Oil prices rose for a record 9th consecutive week to a fresh 7 year high following across the board withdrawals from US oil & product inventories . . . after rising 3.7% to a 7 year high of $82.28 a barrel last week as global shortages of coal and natural gas were expected to lead to increased demand for oil, the contract price for US light sweet crude for November delivery opened higher on Monday as oil traders looked to easing of pandemic restrictions and a colder winter to boost demand, but eased off of multiyear highs to settle just 16 cents higher at $82.44 a barrel, after data showed US industrial production unexpectedly fell 1.3% in September, the most in seven months, implying that industrial demand for energy would be weaker than expected . . . after opening lower, oil rose on Tuesday and was again trading near multiyear highs as an energy supply crunch continued across the globe, and settled 52 cents, or 0.6%, higher at $82.96 a barrel, as renewed worries about natural-gas supplies fed expectations that shortages would boost demand for oil…oil prices moved lower in pre-inventory trade Wednesday, after preliminary data from the American Petroleum Institute showed a much larger-than-expected build in domestic crude oil inventories, but then spiked into positive territory after the EIA reported across the board inventory withdrawals, and settled with a gain of 91 cents as trading in November oil expired with the contract priced at a seven year high of $83.87 a barrel, as gasoline inventories fell to the lowest since November 2019, while gasoline demand was at the highest level in any autumn since 2007 . . . with Thursday’s oil quotes referencing the contract price for US light sweet crude for December delivery, which had risen 98 cents to $83.32 on Wednesday, an initial early rally reversed after NOAA forecast that winter in much of the US would be warmer than average, and then continued lower to finish down 92 cents at $82.20 a barrel, after Russia’s Putin said the OPEC+ cartel, including Russia, might produce more barrels than it had announced.…oil then rallied in early morning trading Friday, with prices supported by a weaker dollar and equities trading near record highs, and then continued to climb on continued tightness in U.S. supply, even as lower coal and gas prices curbed fuel-switching, and finished $1.26 or 1.5%, higher at $83.76 per barrel after Baker Hughes reported the first decline in the number of operating oil rigs in the US since the week ended Sept. 10, underscoring the laggard recovery in domestic production despite elevated price levels . . . hence, oil prices finished the week 1.8% higher, while the December oil contract, which had started the week priced at $81.73 a barrel, ending 2.5% higher, thus completing the ninth consecutive weekly increase and the longest-ever weekly winning streak for front-month WTI contracts, based on Dow Jones Market records going back to April 1983…
With oil prices at a 7 year high, we’ll again put up a long term graph and take a look..
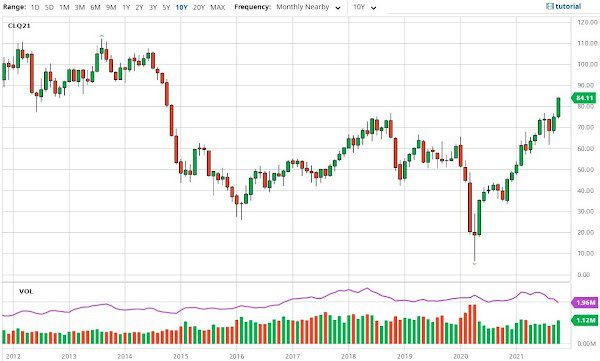
The above is a screenshot of the current interactive oil price chart from barchart.com, which i have again set to show front month oil prices monthly over the past 10 years, which means you’re seeing the same oil prices that were quoted by the media….this interactive chart can also be reset to show prices of front month or individual monthly oil contracts over time periods ranging from 1 day to 30 years, as the menu bar on the top indicates, and also to show oil prices by the minute, hour, day, week or month for each…each bar in the graph above represents the range of oil prices for a single month, with months when prices rose indicated in green, with the opening price at the bottom of the bar and the closing price at the top, and months when prices fell indicated in red, with the opening price at the top of the bar and the closing price at the bottom, while the small sticks above or below each monthly bar represent the extent of the price change above or below the opening and closing price during the month in question….meanwhile, the bars across the bottom show trading volume for the front month oil contract, for the months in question, again with up months indicated by green bars and down months indicated in red . . . you’ll note the price is currently quote at $84.11, reflecting Saturday’s off market trading..
To determine when prices were last at that level, we converted that interactive oil graph to show daily prices, and then tediously scrolled the daily price graph back to 2014 . . . looking for a daily closing price higher than this week’s close $83.76 a barrel, we arrived at October 14th, 2014, when the November 2014 oil contract opened at $84.98 a barrel and closed at $81.84….the next day, oil’s intraday high was $82.45, and it never breached $83 a barrel after that, so this week’s closing price beat a seven year high by 8 days . . . but we’d also note that September 2014 prices never fell below $90.41 a barrel, and closed at $91.16, so it will likely be a while before we’ll see records hitting that level…
Meanwhile, natural gas prices fell for the third straight week, following a seven week surge to a twelve year high on October 5th, as warm weather persisted over most of the US, keeping demand for heating low…..after falling 2.8% to $5.410 per mmBTU last week as mild weather lowered demand and allowed for surplus gas to be stored before winter, the contract price of natural gas for November delivery ignored a 10 percent jump in European natural gas prices after Russia failed to supply additional fuel to Europe and opened 2% lower on Monday as cold weather remained largely absent from long-term forecasts, and continued falling to settle 42.1 cents, or 8% lower at $4.989 per mmBTU, the first close below $5 since September 10th . . . but bargain hunters came back into the market on Tuesday and pushed gas prices up 9.9 cents to $5.088 per mmBTU, even as the weather remained benign, with highs in the 70s as far north as the Dakotas and Minnesota, and then November gas added 8.2 cents to close at $5.170 per mmBTU on Wednesday, as bullish speculators pushed prices higher…the brief rally faltered on Thursday, however, when natural gas slipped 5.5 cents to $5.115 per mmBTU, on a slightly bigger-than-expected storage build, an easing of gas prices in Europe and on forecasts for lower U.S. demand next week than had been expected…but the rally kicked back in on Friday as natural gas prices climbed 16.5 cents or about 3% to a one-week high of $5.280 per mmBTU, on forecasts that cooler weather would soon boost heating and on an increase in global prices, underpinning LNG demand, which nonetheless still left gas prices down 2.4% for the week…
The EIA’s natural gas storage report for the week ending October 15th indicated that the amount of working natural gas held in underground storage in the US rose by 92 billion cubic feet to 3,461 billion cubic feet by the end of the week, which still left our gas supplies 458 billion cubic feet, or 11.7% below the 3,919 billion cubic feet that were in storage on October 15th of last year, and 151 billion cubic feet, or 4.2% below the five-year average of 3,612 billion cubic feet of natural gas that have been in storage as of the 15th of October in recent years…the 92 billion cubic foot increase in US natural gas in working storage this week was a bit higher than the average forecast for a 90 billion cubic foot addition from a Reuters survey of analysts, but well less than the average addition of 69 billion cubic feet of natural gas that have typically been injected into natural gas storage during the same week over the past 5 years, and far below the 49 billion cubic feet that were added to natural gas storage during the corresponding week of 2020…
The Latest US Oil Supply and Disposition Data from the EIA
US oil data from the US Energy Information Administration for the week ending October 15th indicated that after another substantial increase in our oil exports and modest decreases in our oil imports and our oil production, we had to withdraw oil from our stored commercial crude supplies for the eighth time in eleven weeks and for the thirty-fourth time in the past forty-eight weeks….our imports of crude oil fell by an average of 169,000 barrels per day to an average of 5,825,000 barrels per day, after falling by an average of 1,041,000 barrels per day during the prior week, while our exports of crude oil rose by an average of 546,000 barrels per day to an average of 3,060,000 barrels per day during the week, which meant that our effective trade in oil worked out to a net import average of 2,765,000 barrels of per day during the week ending October 15th, 715,000 fewer barrels per day than the net of our imports minus our exports during the prior week…over the same period, production of crude oil from US wells was reportedly 100,000 barrels per day lower at 11,300,000 barrels per day, and hence our daily supply of oil from the net of our international trade in oil and from domestic well production appears to have totaled an average of 14,065,000 barrels per day during the cited reporting week…
US oil refineries reported they were processing an average of 14,990,000 barrels of crude per day during the week ending October 15th, 71,000 fewer barrels per day than the amount of oil they processed during the prior week, while over the same period the EIA’s surveys indicated that a net average of 304,000 barrels of oil per day were being pulled out of the supplies of oil stored in the US….so based on that reported & estimated data, this week’s crude oil figures from the EIA appear to indicate that our total working supply of oil from net imports, from storage, and from oilfield production was 622,000 barrels per day less than what our oil refineries reported they used during the week…to account for that disparity between the apparent supply of oil and the apparent disposition of it, the EIA just plugged a (+622,000) barrel per day figure onto line 13 of the weekly U.S. Petroleum Balance Sheet to make the reported data for the daily supply of oil and the consumption of it balance out, essentially a balance sheet fudge factor that they label in their footnotes as “unaccounted for crude oil”, thus suggesting there must have been a error or omission of that magnitude in this week’s oil supply & demand figures that we have just transcribed….however, since most everyone treats these weekly EIA reports as gospel and since these figures often drive oil pricing and hence decisions to drill or complete wells, we’ll continue to report them as they’re published, just as they’re watched & believed to be reasonably accurate by most everyone in the industry….(for more on how this weekly oil data is gathered, and the possible reasons for that “unaccounted for” oil, see this EIA explainer)….
The weekly Petroleum Status Report (pdf) indicates that the 4 week average of our oil imports fell to an average of 6,352,000 barrels per day last week, which was still 19.5% more than the 5,315,000 barrel per day average that we were importing over the same four-week period last year…the rounded the 304,000 barrel per day net decrease in our crude inventories included 242,000 barrels per day that were pulled out of our commercially available stocks of crude oil, and 62,000 barrels per day of oil that had been stored in our Strategic Petroleum Reserve, part of an emergency loan of oil to Exxon in the wake of hurricane Ida….this week’s crude oil production was reported to be 100,000 barrels per day lower at 11.300,000 barrels per day even though the EIA’s rounded estimate of the output from wells in the lower 48 states was unchanged at 10,900,000 barrels per day because a 22,000 barrel per day decrease in Alaska’s oil production to 431,000 barrels per day subtracted 100,000 barrels per day from the reported rounded national production total….US crude oil production had hit a pre-pandemic record high of 13,100,000 barrels per day during the week ending March 13th 2020, so this week’s reported oil production figure was 13.7% below that of our pre-pandemic production peak, but 34.1% above the interim low of 8,428,000 barrels per day that US oil production had fallen to during the last week of June of 2016…
US oil refineries were operating at 84.7% of their capacity while using those 14,990,000 barrels of crude per day during the week ending October 15th, down from 86.7% of capacity the prior week, and below normal utilization for early autumn refinery operations…the 14,990,000 barrels per day of oil that were refined this week were still 15.1% more barrels than the 13,026,000 barrels of crude that were being processed daily during the pandemic impacted week ending October 16th of last year, but 5.5% less than the 15,865,000 barrels of crude that were being processed daily during the week ending October 18th, 2019, when US refineries were operating at what was then also a below normal 85.2% of capacity, a two year low at that time…
Even with this week’s decrease in the amount of oil being refined, the gasoline output from our refineries was higher, increasing by 455,000 barrels per day to10,060,000 barrels per day during the week ending October 15th, after our gasoline output had increased by 239,000 barrels per day over the prior week.…this week’s gasoline production was 12.6% more than the 8,933,000 barrels of gasoline that were being produced daily over the same week of last year, but still 0.4% lower than the gasoline production of 10,098,000 barrels per day during the week ending October 18th, 2019….on the other hand, our refineries’ production of distillate fuels (diesel fuel and heat oil) decreased by 289,000 barrels per day to 4,417,000 barrels per day, after our distillates output had decreased by 72,000 barrels per day over the prior week…even after this week’s decrease, our distillates output was still 6.9% more than the 4,131,000 barrels of distillates that were being produced daily during the week ending October 16th, 2020, but 7.3% less than the 4,765,000 barrels of distillates that were being produced daily during the week ending October 18th, 2019..
Despite the increase in our gasoline production, our supply of gasoline in storage at the end of the week decreased for the second time in five weeks, and for fifteenth time in twenty-seven weeks, falling by 5,368,000 barrels to a 23 month low of 217,739,000 barrels during the week ending October 15th, after our gasoline inventories had decreased by 1,958,000 barrels over the prior week…our gasoline supplies decreased by more this week because the amount of gasoline supplied to US users rose by 448,000 barrels per day to 9,634,000 barrels per day, while our imports of gasoline rose by 63,000 barrels per day to 606,000 barrels per day, and while our exports of gasoline fell by 166,000 barrels per day to 533,000 barrels per day…after this week’s inventory decrease, our gasoline supplies were 4.1% lower than last October 16th’s gasoline inventories of 227,016,000 barrels, and about 3% below the five year average of our gasoline supplies for this time of the year…meanwhile, the running four week average for gasoline supplied, indicating gasoline demand, was the highest ever for mid-October…
With the decrease in our distillates production, our supplies of distillate fuels also decreased, for the eighth time in ten weeks and for the 19th time in 29 weeks, falling by 1,913,000 barrels to an 18 month low of 129,307,000 barrels during the week ending October 15th,after our distillates supplies had decreased by 24,000 barrels during the prior week….our distillates supplies fell by more this week because the amount of distillates supplied to US markets, an indicator of our domestic demand, rose by 346,000 barrels per day to 4,278,000 barrels per day, while our imports of distillates rose by 12,000 barrels per day to 202,000 barrels per day, and while our exports of distillatesfellby 68,000 barrels per day to 900,000 barrels per day…after nineteen inventory decreases over the past twenty-eight weeks, our distillate supplies at the end of the week were 22.0% below the 160,719,000 barrels of distillates that we had in storage on October 16th, 2020, and about 10% below the five year average of distillates stocks for this time of the year…
Meanwhile, after the decrease in our oil imports and the increase in our oil exports, our commercial supplies of crude oil in storage fell for the twenty-second time in the past tthirty weeks and for the 34th time in the past year, decreasing by 431,000 barrels over the week, from 426,975,000 barrels on October 8th to 426,544,000 barrels on October 15th, after our commercial crude supplies had increased by 6,088,000 barrels over the prior week…after this week’s modest decrease, our commercial crude oil inventories remained about 6% below the most recent five-year average of crude oil supplies for this time of year, but were still about 28% above the average of our crude oil stocks at the third weekend of October over the 5 years at the beginning of the past decade, with the disparity between those comparisons arising because it wasn’t until early 2015 that our oil inventories first topped 400 million barrels….since our crude oil inventories had jumped to record highs during the Covid lockdowns of last spring and remained elevated for most of the year after that, our commercial crude oil supplies as of this October 15th were 12.6% less than the 488,107,000 barrels of oil we had in commercial storage on October 16th of 2020, and are now 1.5% less than the 433,151,000 barrels of oil that we had in storage on October 18th of 2019, but are still 0.9% more than the 422,787,000 barrels of oil we had in commercial storage on October 19th of 2018…
Finally, with our inventory of crude oil and and our supplies of all products made from oil still near multi year lows, we are continuing to track the total of all U.S. Stocks of Crude Oil and Petroleum Products, including those in the SPR….we find that total oil and oil product inventories, including those in the Strategic Petroleum Reserve and those held by the oil industry, fell by 11,499,000 barrels this week, from 1,855,682,000 barrels on October 8th to 1,844,183,000 barrels on October 15th, but they remain 2,556,000 barrels higher than the six year low of four weeks earlier…