Blogger RJS, Focus On Fracking, OPEC Decides to Increase Production, Natural Gas Prices Fall by the most in 8 years and maybe most ever Oil for the sixth consecutive week this week, as OPEC decided to increase production even as a Omicron surge loomed . . . after falling 10.4% to .15 a barrel last week after the discovery of a new Covid variant sent global markets tumbling, the contract price for US light sweet crude for January delivery opened 2% higher on Monday on bargain hunting by oil traders returning to the market following “black Friday’s” 13% plunge, and rallied more than 5% to trade as high as .93, before paring the day’s gains to settle .80 higher at .95 a barrel, as traders turned their focus to the upcoming meeting among
Topics:
run75441 considers the following as important: Focus on Fracking, RJS, US/Global Economics
This could be interesting, too:
Joel Eissenberg writes How Tesla makes money
Angry Bear writes True pricing: effects on competition
Angry Bear writes The paradox of economic competition
Angry Bear writes USMAC Exempts Certain Items Coming out of Mexico and Canada
Blogger RJS, Focus On Fracking, OPEC Decides to Increase Production, Natural Gas Prices Fall by the most in 8 years and maybe most ever
Oil for the sixth consecutive week this week, as OPEC decided to increase production even as a Omicron surge loomed . . . after falling 10.4% to $68.15 a barrel last week after the discovery of a new Covid variant sent global markets tumbling, the contract price for US light sweet crude for January delivery opened 2% higher on Monday on bargain hunting by oil traders returning to the market following “black Friday’s” 13% plunge, and rallied more than 5% to trade as high as $72.93, before paring the day’s gains to settle $1.80 higher at $69.95 a barrel, as traders turned their focus to the upcoming meeting among OPEC and Russia-led partners, and the possible delay of their planned production increase in light of renewed travel resections tied to the emergence omicron variant of Covid . . . but oil prices tumbled nearly 5 percent on Tuesday after Moderna’s CEO cast doubt on the efficacy of COVID-19 vaccines against the Omicron variant, spooking financial markets and adding to worries about oil demand, as oil settled $3.77 lower at $66.18 a barrel, thus ending November 20.8% lower, the biggest monthly drop in prices since March 2020 . . . oil prices jumped more than 4% ahead of the OPEC meeting early Wednesday on speculation the producer’s group might pause their supply hikes, but pared a portion of the gains late morning Wednesday after an inventory report from the EIA showed domestic crude oil production jumped to an 18-month high, and gasoline and distillate fuels supplies registered large builds, only to completely reverse the morning rally to fall 5% and settle 61 cents lower at $65.57 per barrel, after the CDC announced the first US case of Omicron…oil prices whipsawed between 5% lower and 3% higher on Thursday, as traders reassessed near-term supply fundamentals after OPEC+ unexpectedly decided to proceed with a 400,000-barrel-per-day (bpd) production increase, a move that was expected to exacerbate a buildup in global oil inventories, and settled 93 cents higher at $66.50 a barrel, even as the alliance said in a statement that “the meeting remains in session,” suggesting they could “make immediate adjustments” should the current market conditions shift . . . oil prices continued higher early Friday, rising as much as 4% at one point, after the OPEC+ alliance said it could immediately revisit that 400,000 bpd increase if demand suffers in coming weeks, but again reversed and gave back all its gains, closing 24 cents lower at $66.26 a barrel, as a weaker-than-expected US jobs report and the rapidly spreading omicron variant added uncertainty to demand outlooks, and thus closed down for the sixth straight week, the longest stretch of weekly declines since 2018, and 2.8% lower than last Friday’s close…
To illustrate how oil prices ran up to a 7 year high of $83.83 on October 25th only to tumble back to a three month low this week, we’ll include a graph below showing the trajectory of oil prices over the past 6 months..
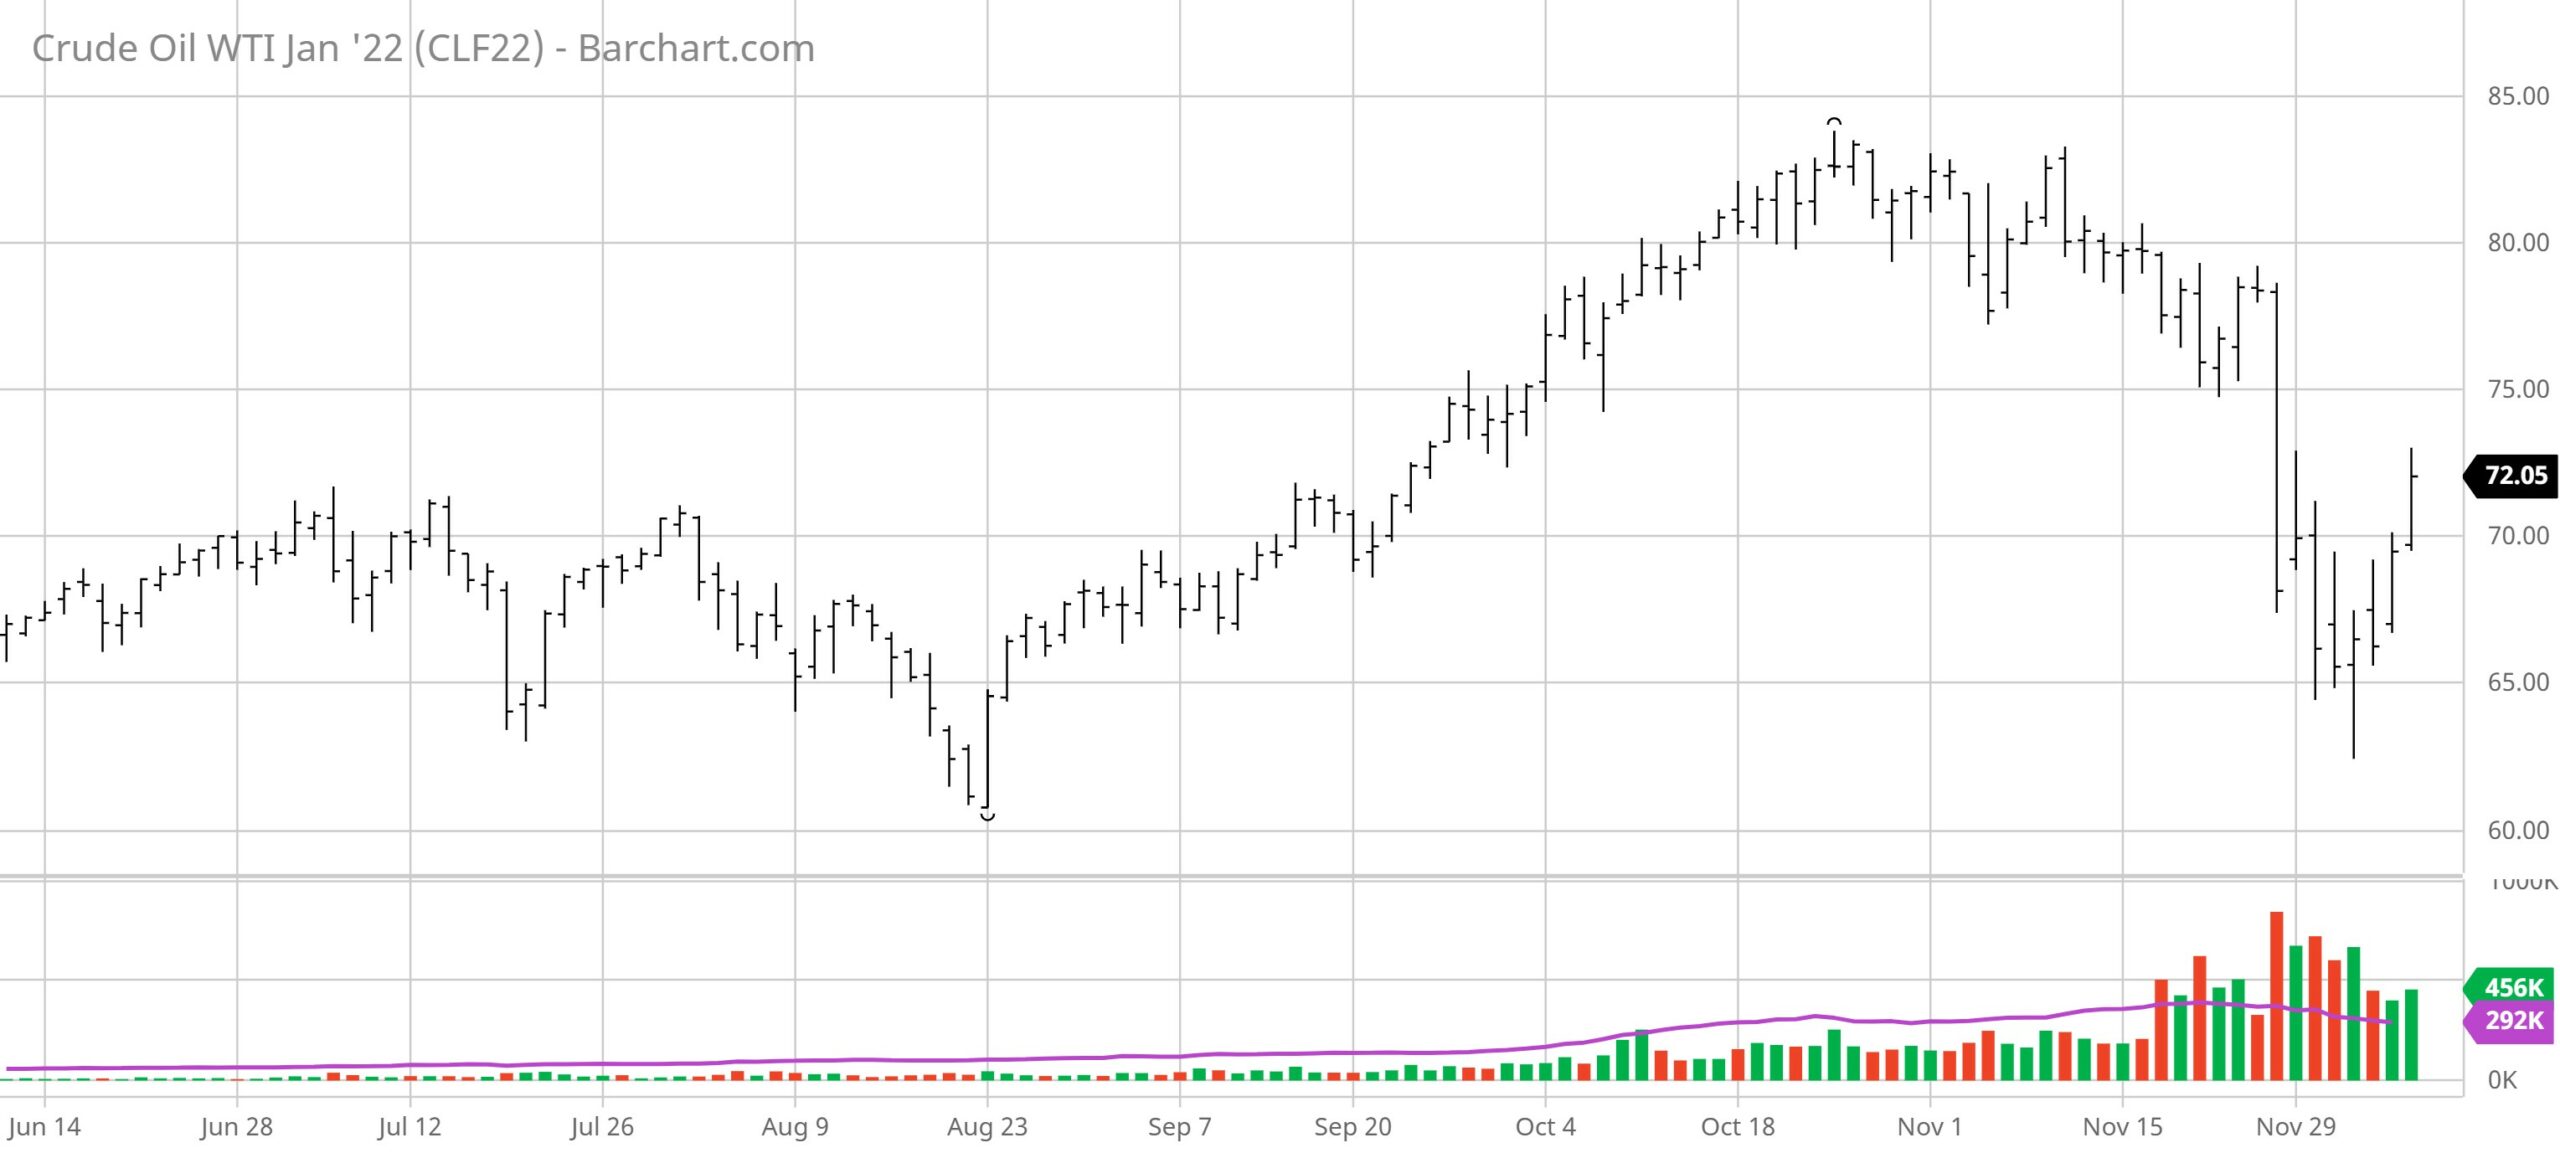
Above is a screenshot of the current contract’s interactive oil price chart from barchart.com, which i have set to show daily oil prices for the January 2022 oil contract over the past 6 months . . . the same chart can be reset to show prices of front month or individual monthly oil contracts over time periods ranging from 1 day to 30 years, as the menu bar on the top indicates, and also to show oil prices by the minute, hour, day, week or month for each…each bar in the graph above represents the range of oil prices for one day, with days when prices rose indicated in green, with that day’s opening price at the bottom of the bar and the day’s closing price at the top, while days when prices fell are indicated in red, with the opening price at the top of the bar and the closing price at the bottom…the small barely visible sticks above or below each monthly bar represent the extent of the price change above or below the opening and closing price during the day in question…. likewise, the bars across the bottom show trading volume for the January oil contract for the days in question, again with up days indicated by green bars and down days indicated in red . . . especially noteworthy on the graph above is the 13.1% drop in prices on Friday of last week, the largest daily drop since April 2020 (when oil prices fell below $0), when global markets tanked with the discovery of the new Covid strain…
Meanwhile, this week’s natural gas prices fell by the most in nearly 8 years due to a forecast for a warm December, increasing expectations that gas supplies would remain adequate for the rest of winter….after the contract price of natural gas for December delivery rose 7.5% to expire at $5.447 per mmBTU last week on higher domestic heating demand and record global gas prices, this week’s natural gas trading started with the contract price of natural gas for January delivery plummeting 62.3 cents or 11.4% to $4.854 per mmBTU, as forecasts shifted warmer through the middle of December, allaying concern about tight domestic supplies amid a global shortage of the fuel . . . natural gas prices continued tumbling Tuesday, shedding another 28.7 cents or nearly 6%, to settle at a 3 month low of $4.567 per mmBTU, as traders looked past robust demand for U.S. exports and fixated on exceptionally light domestic heating demand expectations heading well into December, as natural gas contracts ended November down more than 15%, the biggest monthly percentage loss since January 2020 . . . natural gas prices were down almost 7% again on Wednesday in falling 30.9 cents to another 3 month low at $4.258 per mmBTU, on going forecasts for mild winter weather, record gas production, and ample amounts of gas in storage, and then gave up early gains to fall another 20.2 cents, or 4.7% to $4.056 per mmBTU on Thurday, after the latest government storage data failed to generate any buzz in the market…natural gas prices finally managed to gain 7.6 cents or nearly 2% on Friday, on forecasts for slighly cooler weather, rising LNG exports and a small decline in output to finish the week at $4.132 per mmBTU, still down 24% from the prior week and the biggest weekly decline since February 2014 . . .
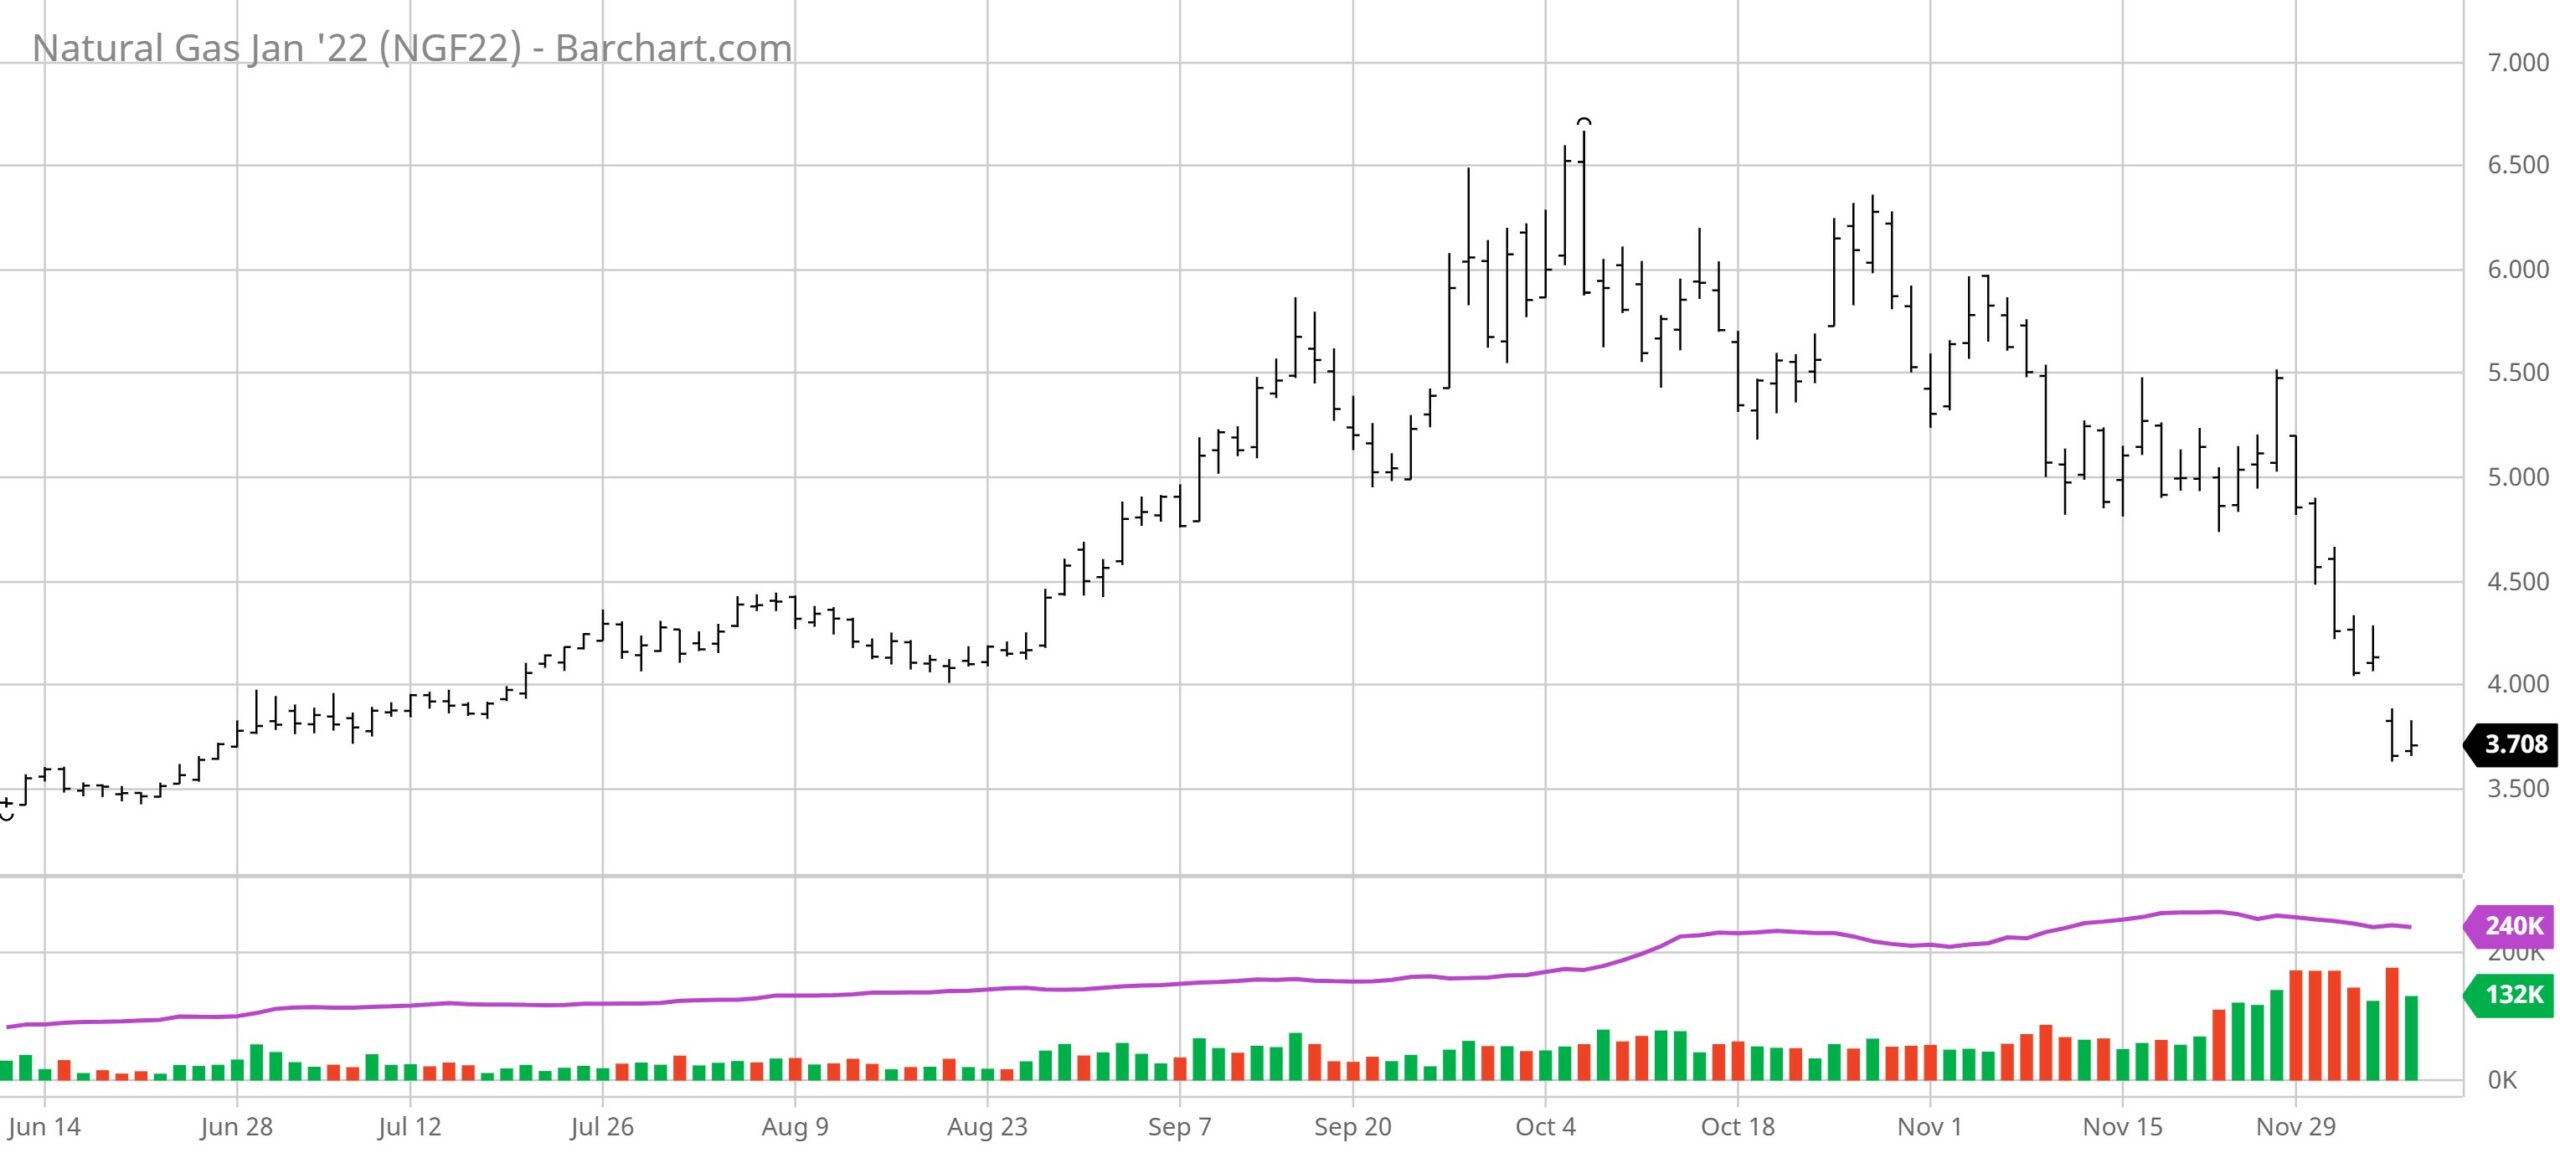
You will note I cited Reuters for the “biggest weekly decline since February 2014”; curious to see what happened back then, i brought up an interactive natural gas price graph, set it to show weekly prices changes, and scrolled back over recent natural gas price history to see what might have happened at that time . . . as it turned out, there was no weekly price decline of this week’s magnitude shown during February 2014; the worst down week that month was the week of February 24, when natural gas prices opened at $5.089 and closed at $4.609, and the week over week change was minus 40.3 cents . . . earlier that month, during the week ending February 3rd, 2014, there was more volatility, with a 99.8 cent difference between the high and low price, but at the end of the week prices were only down 16.8 cents . . . so whatever Reuters was looking at there, i didn’t see it . . . in fact, I think this week’s drop was the greatest on record, but that’s a conclusion I have arrived at by manually searching for big price changes, which could be prone to error . . .

The above graph is a screenshot of the current interactive natural gas price chart from barchart.com, which i have set to show front month natural gas prices weekly over the past 20 years, which means you’re seeing the range of natural gas prices over that time as they were quoted daily by the media . . . again, this same chart can be reset to show prices of front month or individual monthly natural gas contracts over time periods ranging from 1 day to 30 years, as the menu bar on the top indicates, and also to show natural gas prices by the minute, hour, day, week or month for each…each bar in the graph above represents the range of natural gas prices for a single week, with weeks when prices rose indicated in green, and weeks when prices fell indicated in red, with the small barely visible sticks above or below each weekly bar representing the extent of the price change above or below the opening and closing price for the week in question….likewise, the bars across the bottom show trading volume for the weeks in question, again with up weeks indicated by green bars and down weeks indicated in red…
You can see that on the 5 year graph above, this week’s $1.345, or 24% drop in natural gas prices shows up as a large red bar, clearly the largest red bar on the graph, hence telling us that this week’s price drop was the largest over the 5 year span of the graph . . . the only other weekly red bar that’s close is that of December 10, 2018, when natural gas prices opened at $4.590 and closed at $3.827, prices one can get directly from this interactive graph by hovering one’s cursor over the date in question…thus it’s just a simple matter of scrolling back through the prior years on the graph looking for a red bar the size of this week’s and checking the data . . . so I went back past 10 years and found nothing close to a 24% drop; moreover, I did not see a weekly drop in natural gas prices of any magnitude until after the 2008 price spike . . . while there were a couple occasions that year when nominal prices fell a bit more than this week’s $1.345, that was when natural gas prices were over $10, so the percentage drop back then was much less than this week, not any more than 16%…
The EIA’s natural gas storage report for the week ending November 26th indicated that the amount of working natural gas held in underground storage in the US fell by 59 billion cubic feet to 3,564 billion cubic feet by the end of the week, which left our gas supplies 375 billion cubic feet, or 9.5% below the 3,939 billion cubic feet that were in storage on November 26th of last year, and 86 billion cubic feet, or 2.4% below the five-year average of 3,650 billion cubic feet of natural gas that have been in storage as of the 26th of November over the most recent years…the 59 billion cubic foot withdrawal from US natural gas working storage this week was in line with the average forecast for a 58 billion cubic foot withdrawal from Reuters, Bloomberg and Natural Gas Intelligence’s surveys of analysts, but it dwarfed the 4 billion cubic feet that were pulled from natural gas storage during the corresponding week of 2020, and was almost double the average withdrawal of 31 billion cubic feet of natural gas that have typically been pulled out natural gas storage during the same week over the past 5 years…