Others are calling October at 8.6% equal to September’s record, but adding additional decimal points shows October +8.6265% clearly higher than September’s +8.5931% “Record 8.6% Annual Increase in October Producer Price Index; Record 14.2% Increase for Final Demand Goods, and a 46 year Record for Prices of Intermediate Goods,” RJS, MarketWatch 666 The seasonally adjusted Producer Price Index (PPI) for final demand rose 0.6% in October, as prices for finished wholesale goods rose 1.2% while margins of final services providers were 0.2% higher . . . that increase followed a a 0.5% increase in September, when prices for finished wholesale goods rose 1.3% while margins of final services providers were 0.2% higher, a 0.7% increase in August, when
Topics:
run75441 considers the following as important: MarketWatch 666, RJS, US/Global Economics
This could be interesting, too:
Joel Eissenberg writes How Tesla makes money
Angry Bear writes True pricing: effects on competition
Angry Bear writes The paradox of economic competition
Angry Bear writes USMAC Exempts Certain Items Coming out of Mexico and Canada
Others are calling October at 8.6% equal to September’s record, but adding additional decimal points shows October +8.6265% clearly higher than September’s +8.5931%
“Record 8.6% Annual Increase in October Producer Price Index; Record 14.2% Increase for Final Demand Goods, and a 46 year Record for Prices of Intermediate Goods,” RJS, MarketWatch 666
The seasonally adjusted Producer Price Index (PPI) for final demand rose 0.6% in October, as prices for finished wholesale goods rose 1.2% while margins of final services providers were 0.2% higher . . . that increase followed a a 0.5% increase in September, when prices for finished wholesale goods rose 1.3% while margins of final services providers were 0.2% higher, a 0.7% increase in August, when prices for finished wholesale goods rose 1.0% and margins of final services providers rose 0.7%, a now revised July report that indicated the PPI was 0.7% higher, as prices for finished wholesale goods rose 0.5% while margins of final services providers rose 0.9%, and a re-revised June report that has the PPI 0.7% higher, with prices for finished wholesale goods 1.2% higher while margins of final services providers rose 0.6% . . . on an unadjusted basis, producer prices are a record 8.6% higher than a year ago, fractionally higher than but statistically matching the 8.6% year over year increase reported for September’s producer prices, while the core producer price index, which excludes food, energy and trade services, rose by 0.4% for the month, and is now 6.2% higher than in a year ago, up from the 5.9% year over year increase that was indicated in September, but down from the record 6.3% year over year increase that was reported in August.
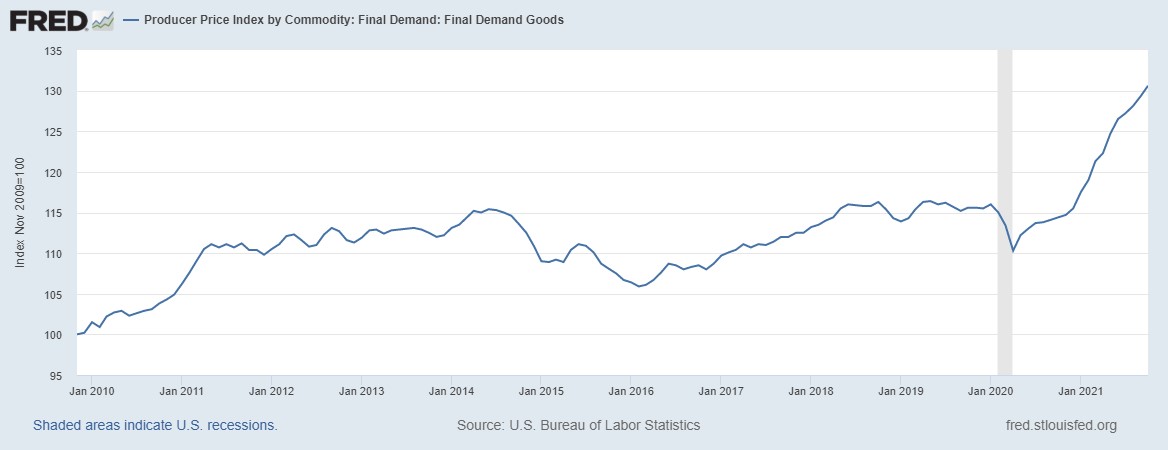
As noted, the price index for final demand for goods, previously called ‘finished goods’, was 1.2% higher in October, after being 1.3% higher in September,1.0% higher in August, 0.5% higher in July. 1.2% higher in June, 1.5% higher in May, 0.7% higher in April, 1.5% higher in March, 1.6% higher in February, 1.6% higher in January, 0.9% higher in December, 0.4% higher in November, and 0.5% higher in October of last year, and hence is now up by a record 14.2% from a year ago . . . the finished goods price index rose 1.2% in October as the price index for wholesale energy goods was 4.8% higher, after it had risen by 2.8% in September, by 0.4% in August, by 1.9% in July, by 2.9% in June, and by 1.2% in May, and as the price index for wholesale foods rose 0.1%, after rising by 2.0% in September. by 2.9% in August, falling 2.1% in July, rising by 0.8% in June, and rising 2.8% in May, while the index for final demand for core wholesale goods (excluding food and energy) was 0.5% higher, after it had risen by 0.6% in August and in September and by 0.8% in July . . . wholesale energy prices averaged 4.8% higher on a 6.7% increase in wholesale prices for gasoline, a 14.2% increase in wholesale prices for diesel fuel, a 13.3% increase in wholesale prices for liquefied petroleum gas and a 13.0% increase in wholesale prices for home heating oil, while the wholesale food price index rose just 0.1% as a 14.3% increase in the wholesale price index for fresh and dry vegetables and a 3.4% increase in the wholesale price index for finfish and shellfish were offset by a 10.3% decrease in the wholesale price index for beef and veal and a 12.1% decrease in the wholesale price index for eggs for fresh use….among core wholesale goods, the wholesale price index for truck trailers rose 6.6%, the wholesale price index for textile house furnishings rose 4.2%, the wholesale price index for travel trailers and campers rose 3.6%, the wholesale price index for transformers and power regulators rose 2.9%, the wholesale price index for mobile homes rose 2.1%, and the wholesale price index for construction machinery and equipment rose 1.6%, and the wholesale price index for Industrial material handling equipment rose also 1.6%.

At the same time, the index for final demand for services rose 0.2% in October, after rising 0.2% in September, 0.7% in August, a revised 0.8% in July, and by a revised 0.6% in June, and is now up by 5.9% from a year ago, down from the 6.4% year over year increase indicated for September . . . the index for final demand for trade services rose 0.4% and the index for final demand for transportation and warehousing services rose 1.7%, but the core index for final demand for services less trade, transportation, and warehousing services was 0.1% lower… among trade services, seasonally adjusted margins for automobile retailers rose 12.5%, margins for computer hardware, software, and supplies retailers rose 4.6%, margins for flooring and floor coverings retailers rose 3.7%, and margins for lawn, garden, and farm equipment and supplies retailers rose 3.7%, while margins for fuels and lubricants retailers fell 11.0% . . . among transportation and warehousing services, average margins for air transportation of freight rose 3.2%, margins for truck transportation of freight rose 2.5% and margins for courier, messenger, and U.S. postal services rose 1.1% . . . among the components of the core final demand for services index, the price index for price index for arrangement of cruises and tours fell 7.6%, the price index for price index for securities brokerage, dealing, investment advice, and related services fell 6.6%, and the price index for portfolio management fell 2.2%, while the price index for passenger car rental services rose 5.0%.
This report also showed the price index for intermediate processed goods rose 2.1% in October, after rising 1.3% in September, 1.0% in August, a revised 1.4% in July, a revised 1.6% in June, and rising 2.9% in May, 1.9% in April, 3.5% in March, 2.9% in February, and 1.8% in January, 1.4% in December, 0.9% in November, and 0.9% in October of last year . . . the price index for intermediate energy goods rose 7.3% in October, as producer prices for natural gas sold to electric utilities rose 19.7%, producer prices for industrial natural gas rose 11.1%, producer prices for LP gas rose 13.3%, refinery prices for gasoline rose 6.7%, refinery prices for diesel fuel rose 14.2%, refinery prices for jet fuel rose 12.9%, and refinery prices for residual fuels rose 7.9% . . . meanwhile, the price index for intermediate processed foods and feeds fell 0.9%, as the producer price index for meats fell 5.1%, the producer price index for prepared animal feeds fell 2.2%, and the producer price index for fats and oils fell 1.3% . . . at the same time, the core price index for intermediate processed goods less food and energy goods rose 1.1%, the smallest increase since last November, as the producer price index for softwood lumber rose 9.1%, the producer price index for steel mill products rose 4.8%, the producer price index for bolts, nuts, screws, rivets, and washers rose 5.5%, the producer price index for primary nonferrous metals rose 5.3%, the producer price index for secondary nonferrous metals rose 3.2%, the producer price index for flat glass rose 2.6%, the producer price index for plastic packaging products rose 2.5%, the producer price index for phosphates rose 2.4%, and the producer price index for paperboard rose 2.9%, while the producer price index for plywood fell 5.3% and the producer price index for building paper and board fell 5.9%…average prices for intermediate processed goods are now 25.4% higher than in October a year ago, the largest year over year price increase since the year ended January 1975, but just the eleventh increase after 19 consecutive year over year decreases, which had followed 29 months of year over year increases, which had been preceded by 16 months of negative year over year comparisons, as prices for intermediate goods fell every month from July 2015 through March 2016….
Meanwhile, the price index for intermediate unprocessed goods rose rose 8.4% in October, after rising 2.4% in September, 1.0% in August, a revised 2.2% in July, a revised 1.8% in June, and rising 7.2% in May, and by 2.0% in April, after falling by 4.2% in March, but after rising by 11.9% in February, and by 5.3% in January, 2.1% in December, by 6.3% in November, and by 1.3% last October . . . that was as the October price index for crude energy goods rose 23.3% as crude oil prices rose 16.6%, unprocessed natural gas prices rose 33.7%, and coal prices rose 2.4%, while the price index for unprocessed foodstuffs and feedstuffs fell 3.8% on a 14.9% decrease in producer prices for slaughter hogs, a 5.1% decrease in producer prices for slaughter chickens, a 7.6% decrease in producer prices for corn, a 6.5% decrease in producer prices for oilseeds, and a 4.2% decrease in producer prices for alfalfa hay, while producer prices for raw cane sugar and byproducts rose 5.9%…at the same time, the index for core raw materials other than food and energy materials was 1.1% higher, as the price index for raw cotton rose 13.8%, the price index for recyclable paper rose 13.4%, the price index for copper base scrap rose 1.7% and the price index for iron and steel scrap rose 1.5% . . . this raw materials index is now 56.6% higher than a year ago, up from the 45.9% year over year increase in September, but still down from the 57.9% year over year increase recorded in May, and just the twelfth year over year increase after the annual change on this index had been negative from the beginning of 2019 through October of last year…
Lastly, the price index for services for intermediate demand rose 0.2% in October, after rising 0.5% in September, 0.3% in August, a revised 0.4% in July, a revised 1.2% in June, and rising by 0.6% in May, by 1.3% in April, by 0.6% in March, by 0.3% in February, by 1.1% in January, and by 0.7% in December 2020, after being unchanged in November, and rising 0.7% last October . . . the price index for intermediate trade services was 0.7% higher, as margins for intermediate machinery and equipment parts and supplies wholesalers rose 1.7%, margins for intermediate paper and plastics products wholesalers rose 3.2%, and margins for intermediate building materials, paint, and hardware wholesalers rose 4.8%, while margins for intermediate hardware, building material, and supplies retailers fell 2.6% . . . meanwhile, the index for transportation and warehousing services for intermediate demand was 0.8% higher, as the intermediate price index for air transportation of freight rose 3.2%, the intermediate price index for truck transportation of freight rose 2,5%, the intermediate price index for air mail and package delivery services excluding by USPS rose 1.6%, and the intermediate price index for the US postal service rose 1.3%, while the intermediate price index for arrangement of freight and cargo fell 0.6% . . . however, the core price index for intermediate services other than trade, transportation, and warehousing services fell 0.1%, as the intermediate price index for securities brokerage, dealing, investment advice and related services fell 6.6%, the intermediate price index for internet advertising space sales excluding Internet ads sold by print publishers fell 5.4%, the intermediate price index for radio advertising time sales fell 3.4%, and the intermediate price index for portfolio management fell 2.2%, while the intermediate price index for for passenger car rental rose 5.0%, the intermediate price index for metal treatment services rose 3.8%, and the intermediate price index for business loans (partial) rose 2.7%…over the 12 months ended in September, the year over year price index for services for intermediate demand is still 7.4% higher than it was a year ago, the thirteenth consecutive positive annual change since it briefly turned negative year over year from April to August of last year, but down from the record 9.3% year over year increase now shown for June….