September Trade Deficit Rises 11.2% to a Record High on Lower Exports of Precious Metals, Oil & Oil Products and Capital Goods, MarketWatch 666, Commenter and Blogger RJS Our trade deficit rose by 11.2% in September as the value of our exports decreased and value of our imports increased…the Commerce Dept report on our international trade in goods and services for September indicated that our seasonally adjusted goods and services trade deficit rose by a rounded .1 billion to a record high of .9 billion in September, from a revised August deficit of .8 billion, which had previously been reported at .3 billion . . . the value of our September exports fell by a rounded .4 billion to 7.6 billion on a .1 billion decrease to 2.7
Topics:
run75441 considers the following as important: MarketWatch 666, politics, RJS, trade policy, US/Global Economics
This could be interesting, too:
Robert Skidelsky writes Lord Skidelsky to ask His Majesty’s Government what is their policy with regard to the Ukraine war following the new policy of the government of the United States of America.
Joel Eissenberg writes No Invading Allies Act
Ken Melvin writes A Developed Taste
Bill Haskell writes The North American Automobile Industry Waits for Trump and the Gov. to Act
September Trade Deficit Rises 11.2% to a Record High on Lower Exports of Precious Metals, Oil & Oil Products and Capital Goods, MarketWatch 666, Commenter and Blogger RJS

Our trade deficit rose by 11.2% in September as the value of our exports decreased and value of our imports increased…the Commerce Dept report on our international trade in goods and services for September indicated that our seasonally adjusted goods and services trade deficit rose by a rounded $8.1 billion to a record high of $80.9 billion in September, from a revised August deficit of $72.8 billion, which had previously been reported at $73.3 billion . . . the value of our September exports fell by a rounded $6.4 billion to $207.6 billion on a $7.1 billion decrease to $142.7 billion in our exports of goods and a $0.6 billion increase to $64.9 billion in our exports of services, while our imports rose by a rounded $1.7 billion to $288.5 billion on a $1.9 billion increase to $240.9 billion in our imports of goods partly offset by a $0.2 billion decrease to $47.6 billion in our imports of services . . . export prices were 0.1% higher in September, which means the relative real change in exports for the month was less than the nominal change by that percentage, while import prices were 0.4% higher, meaning the increase in real imports was also smaller than the nominal dollar change reported here by that percentage….
The decrease in our September exports of goods was due to lower exports of industrial supplies and materials and of capital goods, which were partly offset by increased exports of pharmaceuticals…referencing the Full Release and Tables for September (pdf), in Exhibit 7 we find that our exports of industrial supplies and materials fell by $5,667 million to $51,617 million on a $1,870 million decrease in our exports of non-monetary gold, a $952 million decrease in our exports of crude oil, a $912 million decrease in our exports of petroleum products other than fuel oil, a $888 million decrease in our exports of other precious metals, and a $613 million decrease in our exports of fuel oil, and that our exports of capital goods fell by $1,570 million to $42,272 million on a $329 million decrease of in our exports of semiconductors, a $259 million decrease in our exports of engines for civilian aircraft, a $225 million decrease of in our exports of computer accessories, and also sizable decreases in our exports of industrial engines, civilian aircraft, telecommunications equipment, and medical equipment . . . in addition, our exports of automotive vehicles, parts, and engines fell by $221 million to $10,980 million on a $279 million decrease in our exports of automotive parts other than tires, engines, bodies and chassis, our exports of foods, feeds and beverages fell by $140 million to $12,032 million on a $290 million decrease in our exports of corn, and our exports of other goods not categorized by end use fell by $103 million to $5,468 million . . . partially offsetting the decreases in those end use categories, our exports of consumer goods rose by $711 million to $19,819 million on an $1,482 million increase in our exports of pharmaceuticals, which itself was partly offset by a $400 million decrease in our exports of gem diamonds…
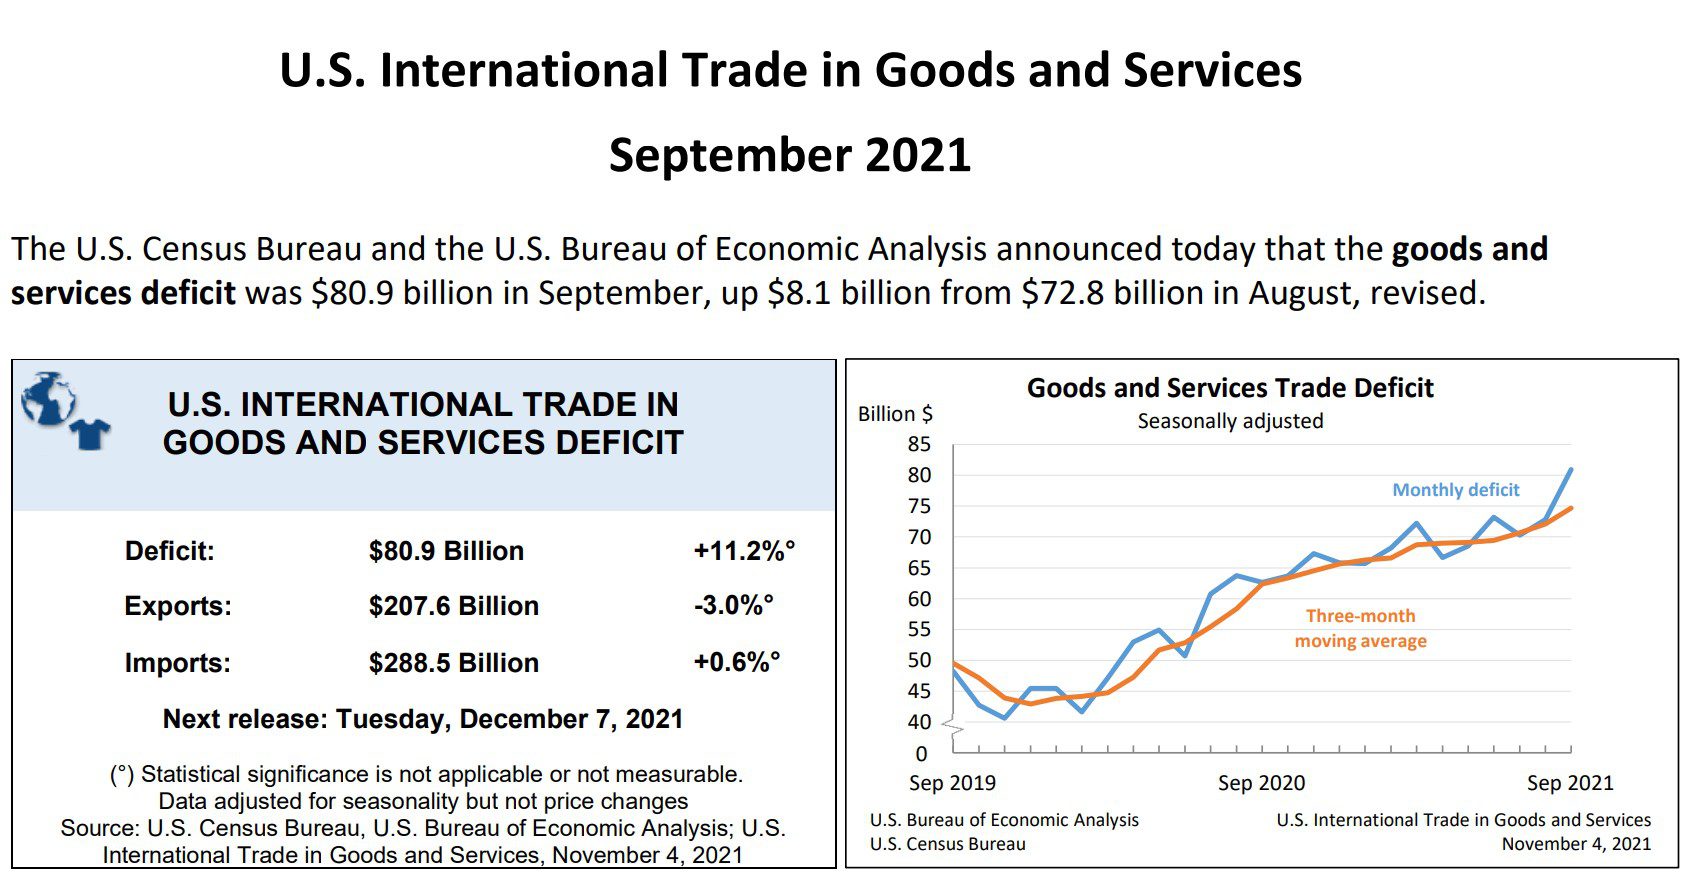
Exhibit 8 in the Full Release and Tables gives us seasonally adjusted details on our goods imports and shows that higher imports of capital goods, of cellphones, and of industrial supplies and materials were responsible for the $2.1 billion increase in our goods imports, while they were partially offset by decreases in our imports of automotive vehicles, parts, and engines and of pharmaceuticals . . . our imports of capital goods rose by $2,537 million to $65,628 million on a $1,201 million increase in our imports of computers, a $456 million increase in our imports of electric apparatuses, a $330 million increase in our imports of drilling & oilfield equipment, and a $330 million increase in our imports of civilian aircraft, and our imports of industrial supplies and materials rose by $985 million to $57,981 million on a $856 million increase in our imports of organic chemicals, a $408 million increase in our imports of crude oil, a $391 million increase in our imports of iron and steel mill products, and a $293 million increase in our imports of petroleum products other than fuel oil, while our imports of other goods not categorized by end use rose by $820 million to $10,969 million . . . partially offsetting the increases in those categories, our imports of automotive vehicles, parts and engines fell by $2,151 million to $25,854 million on a $1,738 million decrease in our imports of new & used passenger cars and a $653 million decrease in our imports of automotive parts other than tires, engines, bodies and chassis, and our imports of our imports of consumer goods fell by $81 million to $63,153 million, as a $1,303 million decrease in our imports of pharmaceuticals, a $652 million increase in our imports of gem diamonds and a $430 million decrease in our imports of furniture and related household goods were mostly offset by a $1,790 million increase in our imports of cell phones and related goods, while our imports of foods, feeds, and beverages fell by $53 million to $15,632 million on a $270 million decrease in our imports of fish & shellfish…
The Full Release and Tables pdf for this month’s report also summarizes Exhibit 19, which gives us surplus and deficit details on our goods trade with selected countries:
The September figures show surpluses, in billions of dollars, with South and Central America ($3.8), Hong Kong ($1.5), and Brazil ($1.2). Deficits were recorded, in billions of dollars, with China ($31.5), European Union ($18.7), Mexico ($8.8), Germany ($5.7), Japan ($5.0), Canada ($4.7), South Korea ($3.8), Taiwan ($3.8), Italy ($3.5), India ($2.6), France ($1.8), Saudi Arabia ($0.5), United Kingdom ($0.1), and Singapore (less than $0.1).
- The deficit with China increased $3.4 billion to $31.5 billion in September. Exports decreased $0.2 billion to $11.0 billion and imports increased $3.2 billion to $42.6 billion.
- The deficit with Mexico increased $2.3 billion to $8.8 billion in September. Exports decreased $1.7 billion to $22.4 billion and imports increased $0.5 billion to $31.3 billion.
- The deficit with Japan decreased $0.6 billion to $5.0 billion in September. Exports decreased $0.2 billion to $6.0 billion and imports decreased $0.8 billion to $11.0 billion.
In last week’s advance report on 3rd quarter GDP, the contribution of September trade in goods was estimated based on the sketchy Advance Report on our International Trade in Goods which was released last week, just before the GDP release…that report estimated that our seasonal adjusted September goods trade deficit was at $96,252 million on a Census basis, up from the $88,164 million goods deficit in August, on goods exports valued at $142,152 million and goods imports valued at $238,403 million . . . this report revises that and shows that our actual goods trade deficit in September was $98,156 billion on a balance of payments basis, and $97,031 million on a Census basis, on Census adjusted goods exports of $142,187 million and Census adjusted goods imports of $239,218 million…in addition, the Census basis August goods trade deficit was revised from $88,164 million to $89,239 million . . . together, those revisions from the previously published data mean that the 3rd quarter trade deficit in goods was on the order of $1,854 million more than was included in last week’s GDP report, or roughly $7.5 billion on an annualized basis, which would lower 3rd quarter GDP by about 0.14 percentage points when the 2nd estimate is released at the end of November…
For our trade in services, the BEA’s Key source data and assumptions (xls) for the advance estimate of third quarter GDP provides aggregate exports and imports of services at annual rates on an international-transactions-accounts basis, indicating that the BEA assumed a $12.4 billion increase in exports of services and a $3.5 billion increase in imports of services on an annual basis in September when computing 3rd quarter GDP…while there is no comparable annualized metric or adjusted data in this trade report that we could directly compare that to, this release does show that exports of services rose $609 million in September after August’s exports of services were revised $195 million higher, and that imports of services fell $187 million in September after August’s imports of services were revised $68 million lower . . . after multiplying those monthly figures by 12 to approximate an annualized change, that suggests that the annual rate for September exports of services used in the GDP report was on the order of $2.8 billion too high, while the annual rate for September imports of services used in the GDP report was about $6.6 billion too high . . . revising those annualized figures, and also annualizing the services trade revisions for August vis a vis those reported in the same manner, the annual rate for 3rd quarter services exports would be revised about $0.5 billion lower, while the annual rate for 2nd quarter services exports would be revised about $7.4 billion higher…the resulting upward revision of $7.9 billion to our total services surplus in NIPA terms should be enough to add about 0.15 percentage points back to 3rd quarter GDP . . . with services revisions thus offsetting those of goods, it appears that this report will therefore have a negligible impact on 3rd quarter GDP revisions when they’re released on November 24th…