RJS, MarketWatch 666 4th Quarter GDP Grew at a 6.9% Rate, Revised from a 7.0% Rate, as PCE Revised Lower The Third Estimate of our 4th Quarter GDP from the Bureau of Economic Analysis indicated that our real output of goods and services grew at a 6.9% rate in the quarter, revised from the 7.0% growth rate reported in the second estimate last month, as a steep downward revision to personal consumption expenditures more than offset a big upward revision to investment in inventories . . . in current dollars, our fourth quarter GDP grew at a 14.53% annual rate, increasing from what would work out to be a ,202.3 billion a year output rate in the 3rd quarter to a ,002.8 billion annual rate in the 4th quarter, with the headline 6.9% annualized
Topics:
run75441 considers the following as important: Hot Topics, MarketWatch 666, RJS, US EConomics
This could be interesting, too:
NewDealdemocrat writes JOLTS revisions from Yesterday’s Report
Joel Eissenberg writes No Invading Allies Act
Bill Haskell writes The North American Automobile Industry Waits for Trump and the Gov. to Act
Bill Haskell writes Families Struggle Paying for Child Care While Working
RJS, MarketWatch 666
4th Quarter GDP Grew at a 6.9% Rate, Revised from a 7.0% Rate, as PCE Revised Lower
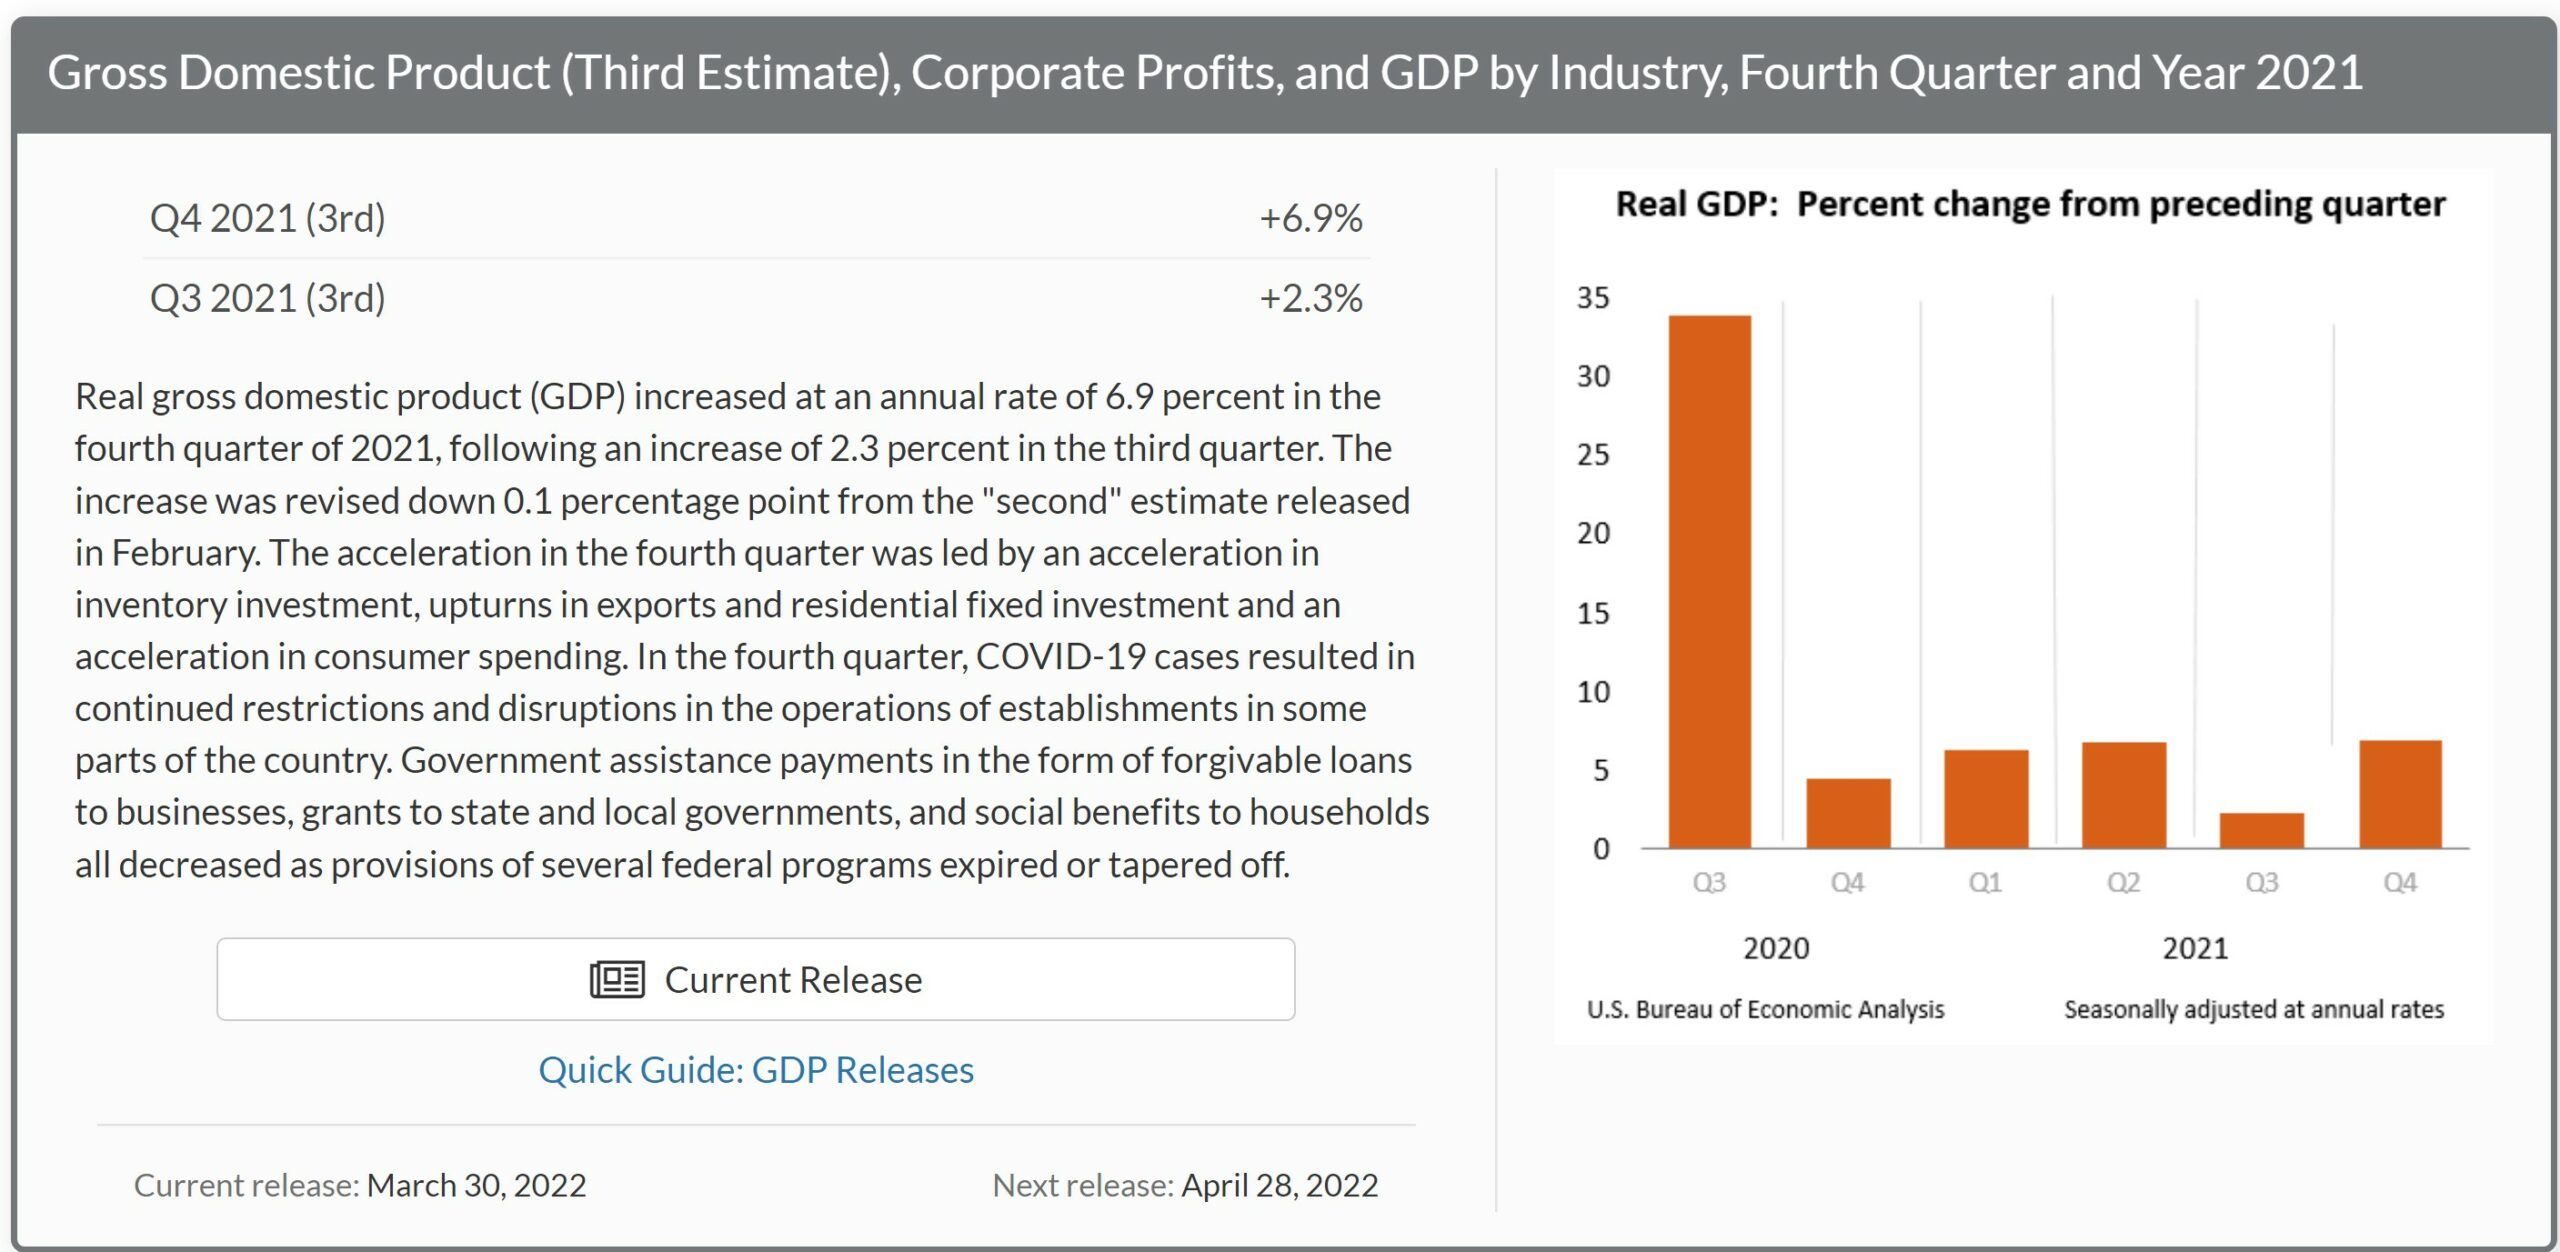
The Third Estimate of our 4th Quarter GDP from the Bureau of Economic Analysis indicated that our real output of goods and services grew at a 6.9% rate in the quarter, revised from the 7.0% growth rate reported in the second estimate last month, as a steep downward revision to personal consumption expenditures more than offset a big upward revision to investment in inventories . . . in current dollars, our fourth quarter GDP grew at a 14.53% annual rate, increasing from what would work out to be a $23,202.3 billion a year output rate in the 3rd quarter to a $24,002.8 billion annual rate in the 4th quarter, with the headline 6.9% annualized rate of increase in real output arrived at an annualized inflation adjustment averaging 7.1%, known in aggregate as the GDP deflator, was computed from the weighted price changes of each of the GDP components and applied to their current dollar change…
Remember that the GDP press release reports all quarter over quarter percentage changes at an annual rate, which means that they’re expressed as a change a bit over 4 times of that what actually occurred over the 3 month period, and that the prefix “real” is used to indicate that each change has been adjusted for inflation using price changes chained from 2012, and then that all percentage changes in this report are calculated from those 2012 dollar figures, which would be better thought of as a quantity indexes than as any reality based dollar amounts . . . for our purposes, all the data that we’ll use in reporting the changes here comes directly from the pdf for the 3rd estimate of 4th quarter GDP, which can be accessed directly on the BEA’s GDP landing page, which also includes links to the tables on Excel and other technical notes about this release . . . specifically, we reference table 1, which shows the real percentage change in each of the GDP components annually and quarterly since the 1st quarter of 2018; table 2, which shows the contribution of each of the components to the GDP figures for those quarters and years; table 3, which shows both the current dollar value and inflation adjusted value of each of the GDP components; and table 4, which shows the change in the price indexes for each of the components . . . the pdf for the 4th quarter second estimate, which this estimate revises, is here…
Growth of real personal consumption expenditures (PCE), the largest component of GDP, was revised from a growth rate of 3.1% to an overall 2.5% growth rate in this 3rd estimate . . . that growth rate figure was arrived at by deflating the 9.04% growth rate in the dollar amount of consumer spending with the PCE price index, which indicated inflation grew at a 6.4% annual rate in the 4th quarter, which was revised from the 6.3% PCE inflation rate reported a month ago, and hence also contributed to the downward revision to real PCE . . . real consumption of durable goods grew at a 2.5% annual rate, which was revised from the 2.7% growth rate shown in the second estimate, and added 0.22 percentage points to GDP, as real growth at a 12.5% rate in consumption of recreational goods and vehicles was mostly offset by lower consumption of motor vehicles, furniture and durable household equipment . . . at the same time, real consumption of nondurable goods by individuals grew at a 0.4% annual rate, revised from the 0.8% growth rate reported in the 2nd estimate, and added 0.06 percentage points to the 4th quarter’s economic growth rate, as falling real consumption of food and beverages and of clothing and footwear was more than offset by greater real consumption of gasoline and other non-durable goods . . . . meanwhile, consumption of services grew at a 3.3% annual rate, revised from the 3.9% growth rate reported last month, and added 1.48 percentage points to the final GDP tally, as real consumption of health care services grew at a 3.7% rate and accounted for almost a third of the quarter’s growth in services…
Seasonally adjusted real gross private domestic investment grew at a 36.7% annual rate in the 4th quarter, revised from the 33.5% growth estimate reported last month, as real private fixed investment grew at a 2.7% rate, revised from the 2.6% growth rate reported in the second estimate, while inventory growth was greater than previously estimated . . . investment in non-residential structures was revised to indicate contraction at a 8.3% rate, up from the 9.4% contraction rate previously reported, while real investment in equipment grew at 2.8% rate, revised up from the 2.4% growth rate shown a month ago . . . meanwhile, the quarter’s investment in intellectual property products was revised down from a 10.6% growth rate to an 8.9% rate, while at the same time real residential investment was shown to be growing at a 2.2% annual rate, revised from the 1.0% growth rate shown in the previous report . . . after those revisions, the increase in investment in non-residential structures subtracted 0.22 percentage points from the 4th quarter’s growth rate, while the increase in investment in equipment added 0.17 percentage points to the quarter’s growth rate, growth in investment in intellectual property added 0.45 percentage points to the growth rate of 4th quarter GDP, and growth in residential investment added 0.10 percentage points to the growth of GDP . . . for an easy to read table as to what’s included in each of those GDP investment categories, see the NIPA Handbook, Chapter 6, page 3….
At the same time, growth of real private inventories was revised from the previously reported $171.2 billion in inflation adjusted growth to show that inventory grew at an inflation adjusted $193.2 billion rate . . . that came after inventories had contracted at an inflation adjusted $66.8 billion rate in the 3rd quarter, and hence the $259.9 billion positive change in real inventory growth from the 3rd to the 4th quarter added 5.32 percentage points to the 4th quarter’s growth rate, revised from the 4.90 percentage point addition to GDP from inventory growth reported in the second estimate . . . however, since a greater growth of inventories indicates that more of the goods produced during the quarter were left in a warehouse or sitting on a shelf, their increase at a $259.9 billion rate conversely meant that real final sales of GDP were actually smaller by that much, and hence real final sales of GDP grew at a 1.5% rate in the 4th quarter, revised from the 2.0% real final sales growth shown in the second estimate, and up from the real final sales growth rate of 0.1% in the 3rd quarter, when inventory growth had accounted for almost all of the quarter’s growth in GDP….
The previously reported increase in real exports was revised lower with this estimate, while the previously reported increase in real imports was revised higher, so on net the net change in our foreign trade was a greater subtraction from GDP rather than was previously reported . . . our real exports grew at a 22.4% rate, revised from the 23.6% growth rate reported in the second estimate, and since exports are added to GDP because they are part of our production that was not consumed or added to investment in our country and hence not captured by another GDP metric, that growth added 2.24 percentage points to the 4th quarter’s growth rate, revised from the 2.35 percentage point addition from exports shown in the previous report . . . meanwhile, the previously reported 17.6% growth rate in our real imports was revised to a 17.9% growth rate, and since imports are subtracted from GDP because they represent either consumption or investment that was added to another GDP component that shouldn’t have been because it was not produced domestically, their increase subtracted 2.46 percentage points from 4th quarter GDP, rather than the 2.42 percentage point subtraction shown last month . . . thus, our deteriorating trade balance subtracted a rounded net of 0.23 percentage points from 4th quarter GDP, rather than the 0.07 percentage point subtraction that had been indicated by the second estimate..
Finally, there was also a slight downward revision to real government consumption and investment in this 3rd estimate, even as the real contraction rate for the entire government sector remained at a 2.6% rate . . . real federal government consumption and investment was seen to have shrunk at a 4.3% rate in this estimate, revised from the 4.5% contraction shown in the second estimate, as real federal outlays for defense shrunk at a 6.0% rate and subtracted 0.24 percentage points from 4th quarter GDP, revised from the 6.1% contraction rate shown previously, while all other federal consumption and investment shrank at a 2.0% rate, revised from the 2.2% shrinkage shown in the 2nd estimate, and subtracted 0.05 percentage points from 4th quarter GDP . . . meanwhile, real state and local consumption and investment was revised from shrinking at a 1.4% rate in the second estimate to shrinking at a 1.6% rate in this estimate, as state and local investment spending shrank at a 6.9% rate and subtracted 0.14 percentage points from 4th quarter GDP, while state and local consumption spending shrunk at a 0.4% rate and subtracted 0.03 percentage points from GDP . . . note that government outlays for social insurance are not included in this government GDP component; rather, they are included within personal consumption expenditures only when such funds are spent on goods or services, thus indicating there had been an increase in the output of those goods or services…
Personal Income Rose 0.2% in February, Personal Spending Rose 0.5%, PCE Price Index Rose 0.6%
The February report on Personal Income and Outlays from the Bureau of Economic Analysis gives us nearly half the data that will go into 1st quarter GDP, since it gives us 2 months of data on our personal consumption expenditures (PCE), which accounts for nearly 70% of GDP, and the PCE price index, the inflation gauge the Fed targets, and which is used to adjust that personal spending data for inflation to give us the relative change in the output of goods and services that our spending indicated . . . this report also provides us with the nation’s personal income data, disposable personal income, which is income after taxes, and our monthly savings rate . . . however, because this report feeds into GDP and other national accounts data, the change reported for each of those metrics are not the current monthly change; rather, they’re seasonally adjusted amounts at an annual rate, ie, they tell us how much income and spending would increase in a year if February’s adjusted income and spending were extrapolated over an entire year….
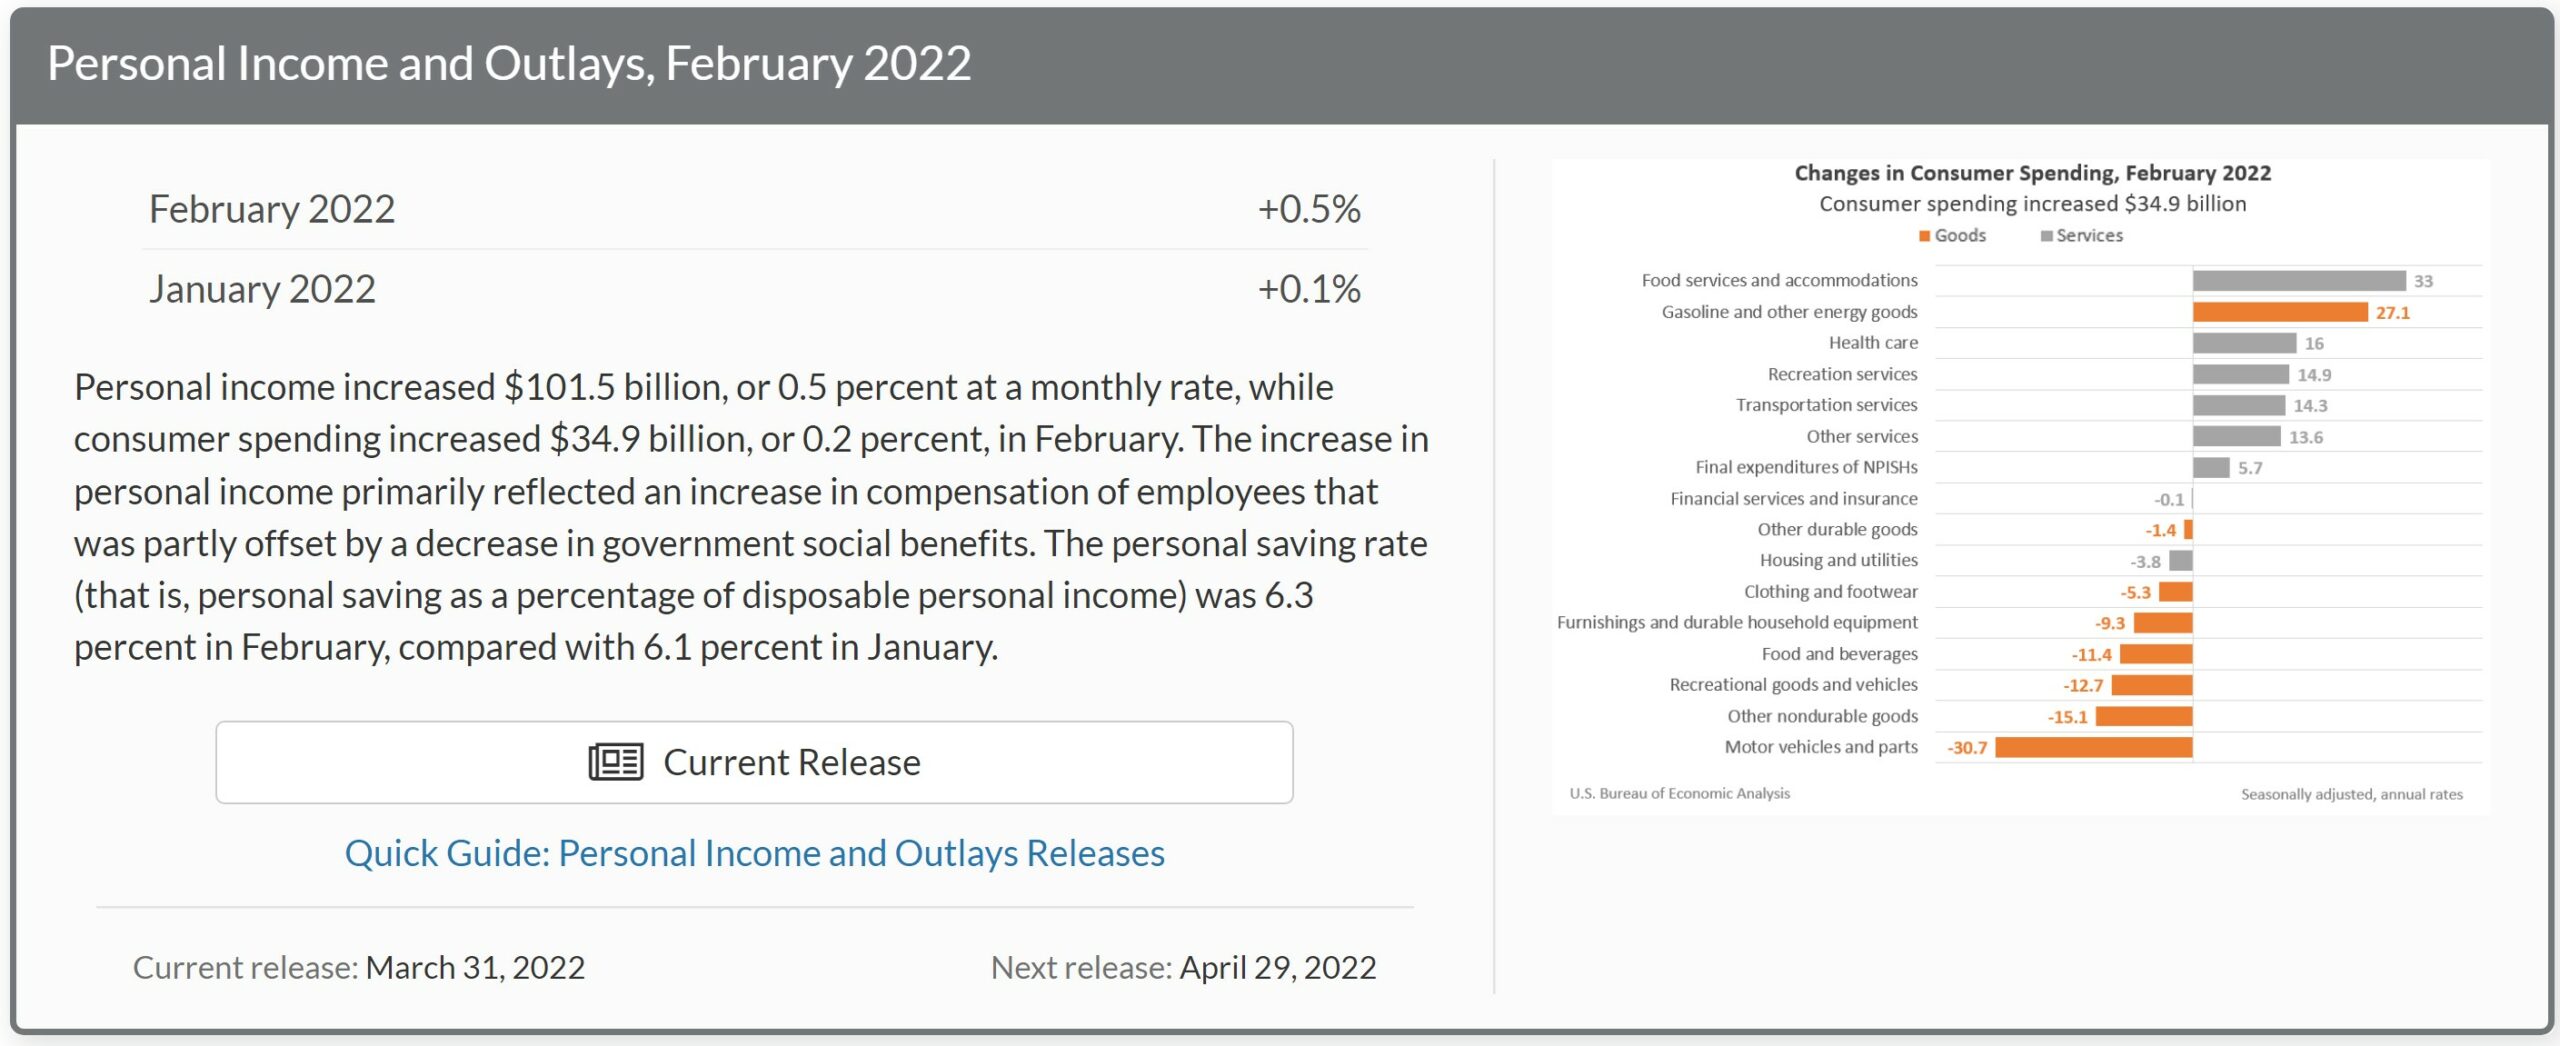
Hence, when the opening line of the press release for this report tell us “Personal income increased $101.5 billion (0.5 percent) in February“, they mean that the annualized figure for US personal income in February, $21,153.3 billion, was $101.5 billion, or less than 0.5% greater than the annualized personal income figure of $21,051.9 for January; the actual change in personal income from January to February is not provided…similarly, annualized disposable personal income, which is income after taxes, rose by less than 0.4%, from an annual rate of an annual rate of $18,284.7 billion in January to an annual rate of $18,360.8 billion in February . . . the components of the monthly increase in personal income, which can be seen in the Full Release & Tables (PDF) for this release, are also annualized figures…in February, the main contributors to the $101.5 billion annualized increase in personal income included an $86.4 billion annual rate of increase in income from wages and salaries and a $14.9 billion annualized increase in business & farm proprietors’ income, which were slightly offset by an $11.0 billion annualized decrease in government social benefits to individuals…
For the personal consumption expenditures (PCE) that will be included in 1st quarter GDP, BEA reports that they increased at a $34.9 billion annual rate, or by roughly 0.2 percent, as the annual rate of PCE rose from $16,678.4 billion in January to $16,713.3 in February, after the January PCE rate was revised up from the originally reported $16,616.0 billion annually . . . the current dollar increase in February spending resulted from a $93.8 billion annualized increase to $10,886.1 billion in annualized in spending for services, which was partly offset by a $58.9 billion decrease to $5,827.2 billion in spending for goods, a decrease which wasn’t particularly evident in the February retail sales report . . . total personal outlays for February, which includes interest payments and personal transfer payments in addition to PCE, rose by an annualized $37.3 billion to $17,212.2 billion annually, which left total personal savings, which is disposable personal income less total outlays, at a $1,148.5 billion annual rate in February, up from the revised $1,109.8 billion in annualized personal savings in January . . . as a result, the personal saving rate, which is personal savings as a percentage of disposable personal income, rose to 6.3% in February from January’s savings rate of 6.1%, with both of those figures lower than any personal savings rate since December 2013…
Before personal consumption expenditures can be used in the 1st quarter GDP computation, they must first be adjusted for inflation to give us the real change in consumption, and hence the real change in goods and services that were produced for that consumption…the BEA does that by computing a price index for personal consumption expenditures, which is a chained price index based on 2012 prices = 100, which is included in Table 9 in the pdf for this report . . . that PCE price index rose from 119.356 in January to 120.047 in February, a month over month inflation rate that’s statistically 0.57894%, which BEA reports as an increase of 0.6 percent, following the PCE price index increase of 0.5% that they reported for January . . . then, applying that 0.57894% inflation adjustment to the nominal increase in February PCE shows that real PCE fell by 0.36756% in February, which the BEA reports as a 0.4% decrease . . . notice that when those PCE price indexes are applied to a given month’s annualized PCE in current dollars, it gives us that month’s annualized real PCE in those same chained 2012 dollars, which are the means that the BEA uses to compare one month’s or one quarter’s real goods and services produced to that of another . . . that result is shown in table 7 of the PDF, where we see that February’s chained dollar consumption total works out to 13,924.0 billion annually, 0.36778% less than January’s 13,975.4 billion, statistically equal to the real PCE decrease we just computed from the index values…
Finally, to estimate the impact of the change in PCE on the change in GDP, we have to compare real PCE from January and February to the the real PCE of the 3 months of the fourth quarter . . . while this report shows PCE for all those months on a monthly basis, the BEA also provides the annualized chained dollar PCE on a quarterly basis in table 8 in the pdf for this report, where we find that the annualized real PCE for the 3 months of the 4th quarter was represented by 13,818.4 billion in chained 2012 dollars . . . (note that’s the same figure shown in table 3 of the pdf for the 4th quarter GDP report) . . . then, by averaging the annualized chained 2012 dollar PCE figures for January and February, 13,975.4 billion and 13,924.0 billion, we get an equivalent annualized PCE for the two months of the 1st quarter that we have the data for so far . . . when we compare that 1st quarter average of 13,949.7 to the 4th quarter chained dollar PCE of 13,818.4, we find that 1st quarter real PCE has grown at a 3.86% annual rate for the two months of the 1st quarter that are included in this report (note the math to get that annual rate: ((( 13,975.4 + 13,924.0 ) / 2 ) / 13,818.4 ) ^ 4 = 1.038552…growth at that rate means that if March real PCE does not improve from the average of January and February, growth in PCE would still add 2.69 percentage points to the growth rate of the 1st quarter…