Medicare is almost 0 billion in gross drug spend: Who gets the blame? — 46brooklyn Research This is a complex issue as there are many moving parts to drug pricing and their costs. Perplexing in describing the drug spend issues would seem appropriate. I am not even sure if this long post will adequately define the issue of how drug prices are set. However, here is another article which I believe may break this down even more so. Later on that one. Just like Social Security, Medicare issues a yearly report. There is one combined report discussing both the Hospital Insurance program (Medicare Part A) and the Supplementary Medical Insurance program (Medicare Part B and Prescription Drug Coverage known as Part D). The Office of the Actuary in
Topics:
run75441 considers the following as important: Brooklyn46 Research, Featured Stories, Healthcare, Medicare, Medicare spend, Pharmaceuticals, politics, US EConomics
This could be interesting, too:
Robert Skidelsky writes Lord Skidelsky to ask His Majesty’s Government what is their policy with regard to the Ukraine war following the new policy of the government of the United States of America.
NewDealdemocrat writes JOLTS revisions from Yesterday’s Report
Joel Eissenberg writes No Invading Allies Act
Ken Melvin writes A Developed Taste
Medicare is almost $200 billion in gross drug spend: Who gets the blame? — 46brooklyn Research
This is a complex issue as there are many moving parts to drug pricing and their costs. Perplexing in describing the drug spend issues would seem appropriate. I am not even sure if this long post will adequately define the issue of how drug prices are set. However, here is another article which I believe may break this down even more so.
Later on that one.
Just like Social Security, Medicare issues a yearly report. There is one combined report discussing both the Hospital Insurance program (Medicare Part A) and the Supplementary Medical Insurance program (Medicare Part B and Prescription Drug Coverage known as Part D). The Office of the Actuary in the Centers for Medicare & Medicaid Services (CMS) prepares the report(s).
From Part D data, Medicare spent $198.65 billion over all in drug expenditures for 2020 (increase of 8.5% over 2019). To realize the magnitude of the $dollars spent, 46Brooklyn gives some purchasing examples of what could be had for almost $200 billion. For example:
- All 32 NFL franchises for $111.485 billion, leaving $87.165 billion left over to buy…
- All 30 NBA franchises for $71.14 billion, with $16 billion left over to buy…
- The top 4 MLB franchises by estimated values (i.e., the NY Yankees, LA Dodgers, Boston Red Sox, & Chicago Cubs) for $15.645 billion. With $380 million left over.
Left over spending money for incidentals such as houses, a large passenger jet, various high cholesterol meals, etc. A potpourri of other things too.
Pharmaceutical pricing keeps increasing, regardless of the drug cost. And, with new drugs coming to market and new uses for old drugs. total costs to the customer increases The next year we would have to spend more either for insurance or deductibles.
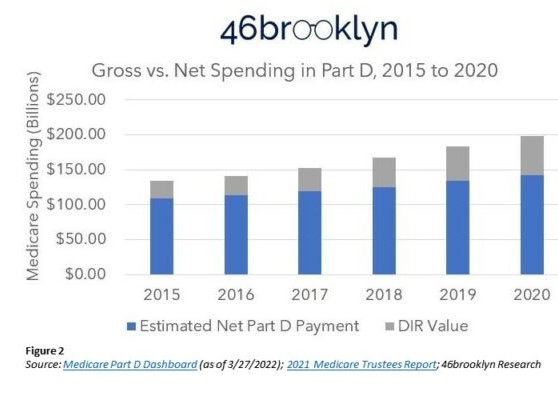
46Brooklyn Medicare Drug Expenditure’s Explanation? It is here I am going to detail some findings starting with Gross versus Net expenditures. Gross equals Part D Payment for pharmaceuticals plus Direct and Indirect Remuneration (DIR). The latter two not being known by the patients but are part of bringing drugs to market and represent a growing cost.
Direct And Indirect Remuneration (DIR):
DIR is a term used in Medicare Part D identifying price concessions impacting gross prescription drug costs “not” captured at the point of sale. They include discounts, chargebacks or rebates, cash discounts, free goods contingent on a purchase agreement, upfront payments, coupons, goods in kind, free or reduced-price services, grants, or other price concessions or similar benefits from “manufacturers, pharmacies, or similar entity.”
Guess who pays for DIR whether you have Medicare Advantage or Traditional Medicare Part D?
In the chart above what you are looking at are drug prices to the consumer broken down into the cost of the drug plus any chargebacks, rebates, cash discounts upfront payments, etc. The DIR goes to PBM (Pharmacy Benefit Managers), Drug Store chains, etc.
The total amount of money spent by Medicare Part D for prescription drugs went from $133.82 Bn in 2015 to $198.65 Bn in 2020. The difference being $64.8 Bn for drug costs which also includes increasing percentages (amounts) for DIR. Any control of drug prices to the consumer considers DIR and payment. As you can see, DIR (Figure 2 above) is increasing.
In Figure 3 below, the costs due to pricing for retirees are increasing for Part D Medicare (blue) and Medicare Advantage (orange). Not a big surprise as baby – boomers reaching the age of retirement become eligible for some form of Medicare. The market is big as also reflected in Figure 3.

The 48% increase in gross drug expenditures is disconnected from the enrollment growth. While increased enrollment numbers play a role in cost growth, Direct and Indirect (DIR) costs (Gray) are becoming a larger portion of the cost as shown in Figure 2. Figure 3 above reflects the total number of Medicare beneficiaries with drug benefits in either Part D (blue) or Medicare Advantage (orange). Enrollment increased by 7.9 million (20%) from 2015 to 2020. Thirty-eight and six tenths million combined enrollment in 2015 has increased to 46.5 million enrolled in 2020. Gross drug expenditures increases were 48%. More $dollars increases per person unrelated to the numbers of people in retirement.
This lays a foundation for making some assumptions using 46Brooklyn data.
Drug Utilization is shown in the graph Figure 4 (left – below) graph. Of the various prescription drug products, ~9 out of 10 of drugs dispensed in 2020 Medicare Part D were generic. The same utilization can be said for the last 5 years.

Eight of every 10 dollars spent were spent on brand name medications in 2020 as shown in the Figure 5 (right – above) graph. The ratio of dollars spent per brand name drug is also increasing year over year.
The growing role of using specialty medications in treating patients is a key reason for an increasing spend for brand name medications and an overall increase also.
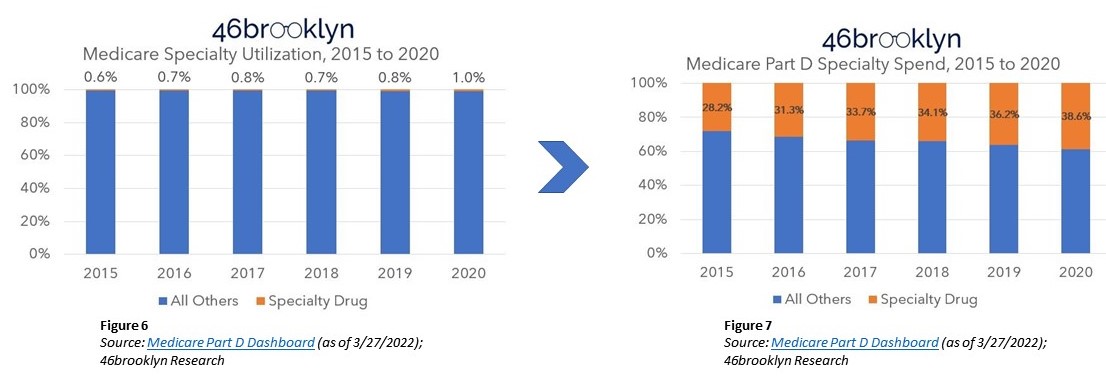
Figures 6 (left – above) represents Specialty drug utilization and Figure 7 (right – above) represents spend percentage of Specialty drugs in relation to all other drugs. Specialty drugs represented 0.6% of utilization and 28.2% of gross cost in 2015. In 2020, Specialty drugs account for ~1% of utilization and were 38.6% of gross costs.
A breather and a brief look at other information to drug pricing which is relative.
I had talked about the pricing of new drugs, brand name drugs, and specialty drugs on the market here; “A Look at Drug Pricing 2020, Costs, and Why – ‘Redux'” – Angry Bear, here: “Can You Patent the Sun?” – Angry Bear, and here: “Sales Income for Drugs have Exceeded Risk Adjusted R & D Costs” – Angry Bear
Sidebar: The basis for usage therapy pricing for new drugs and old drugs with new uses is based on four key measures of value analysis of “the improvements they offer to patients both clinically and in terms of their quality of life, and the resulting benefits to the health-care system and society.” There is interpretive meaning to those four points. Others like the Institute for Clinical and Economic Review (ICER) review prices and new pricing at times. ICER may disagree with the prices set by pharmaceutical companies. ICER bases their determination on effectiveness and value of the drug’s use and evidence submitted.
Back to the topic of Medicare $198.5 billion Gross Drug Spend.
Before I get into the whys, I want to look at Medicaid pricing briefly. Why shouldn’t Medicare pharmaceutical pricing be published? It does not exist or at least does not exist for publication.
Medicare does not give information on drugs at the National Drug Code (NDC) level (despite CMS doing so for Medicaid). 46brooklyn does performs some data analysis on Medicaid’s underlying data.
First and foremost, 46Brooklyn goes through all the unique product and generic name descriptions and labels all values by CMS for Medicare as either BRAND, GENERIC, DME (Durable Medical Equipment), or VACCINE.
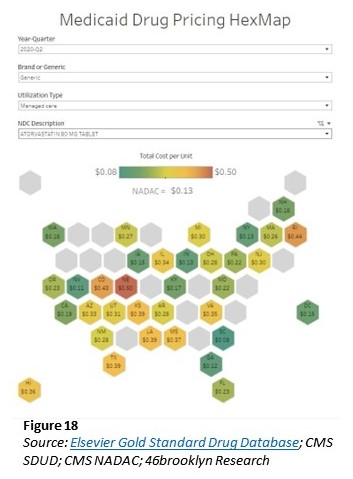
The study reviews Medicare pricing by looking at Medicaid’s pricing for one chosen drug, Atorvastatin (generic Lipitor) in Q2 2020 (chart to the left).
If there is published Medicaid pricing and there is. It seems unusual not to have Medicare pricing. Unless this is a serious flaw or the pricing is well hidden. The Veterans Administration also has drug pricing and negotiates the same. Both drug pricing lists for Medicare is a serious issue as well as allowing it to negotiate prices.
Back to 46brooklyn study. Atorvastatin dispensed by Medicaid is the same drug dispensed by Medicare. Another commonality is many of the same PBMs having Medicare contracts also have Medicaid managed care contracts. We can look at the Medicaid pricing behavior for Atorvastatin (which is generic Lipitor) across the country, we see the NADAC price was $0.13 per unit.
NADAC: National Average Drug Acquisition Cost. A national prescription drug pricing benchmark that is reflective of the invoice prices paid by retail community pharmacies to acquire prescription and over-the-counter covered outpatient drugs.
So, we now have an average acquisition cost for Atorvastatin. We can also see on the chart; some states pay as little as $0.08 per pill. Other states pay as much as $0.50 per pill (Figure 18 – above). The variance raises the question, how can six-times the price difference across these various states be justified? Maybe transportation costs, state taxes, handling fees, etc.?
The study notes it is analyzing list prices versus gross Medicare spend. Both list prices and gross Medicare spend are impacted by massivediscounts and concessions. Negotiations of both are taking place behind the scenes making actual pricing disconnect analyses complex.
Simply looking at what the contract says the price for a drug will be for the purposes of PBM reimbursement, we could understand what the source of drug pricing dysfunction. The contract being difficult to access, we can all but guarantee it says something along the lines of drug pricing (as determined by (46Brooklyn) being the lesser of:
(1) the pharmacy’s usual and customary charge (U&C),
(2) the PBM-set maximum allowable cost (MAC) rate for the drug, or
(3) an AWP-linked discount or guarantee (i.e., drug manufacturer price).
(see below for definitions)
If only one party was responsible for the drug’s price such as the manufacturer’s; why are we asking for the lower charge of what the provider is willing to charge (i.e., the usual and customary)? And why are we relying upon the Pharmacy Benefit Manager (PBM) to derive a payment maximum allowable cost? Those functions could be unnecessary if only the drug manufacturer’s price was what really mattered.
There already exists insight into what may be occurring. It has little to do with the price the manufacturer sets (which may not be reflective of true cost). There is much that can be said about the intermediary pricing set between the manufacturer and the drug supply chain intermediaries.
In “Deserving of better: How American seniors are paying for misaligned incentives within Medicare Part D,” Three Axis Advisors (Disclosure: the 3 Axis Advisors team powers the analytics at 46brookyn) observations of drug’s manufacturer-set price being held the same, the underlying value of gross drug costs can go up over time in Medicare Part D (Figure 19). The study attributes this to retrospective non-manufacturer price changes to drugs occurring in Medicare Part D. CMS is acknowledging the role “clawback” behavior has on drug costs.
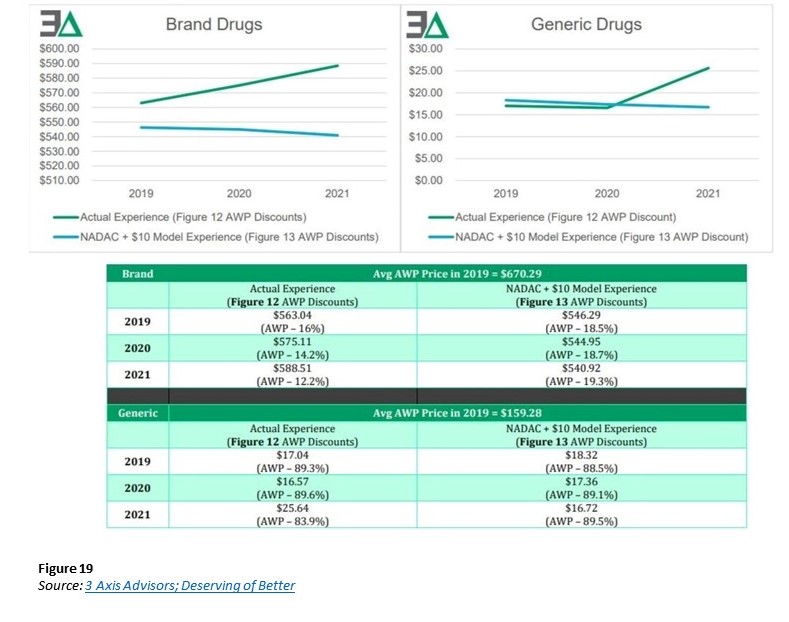
Calculating the correct price using data from numerous points is a daunting task. I am going to show one example of Medicare prices percentage change versus WAC wholesale acquisition cost percentage change.
46Brooklyn Commentary
The crux of what is studied in drug data hasn’t changed, and so the story remains the same. What appears to be happening is some of the best money grabs occurring.
Why would they say something like this? I grabbed one example they mentioned in the text and not shown above.
Looking at Figure 13, we can see a price variance. Medicare Part has twice the price change as what WAC wholesale acquisition cost.
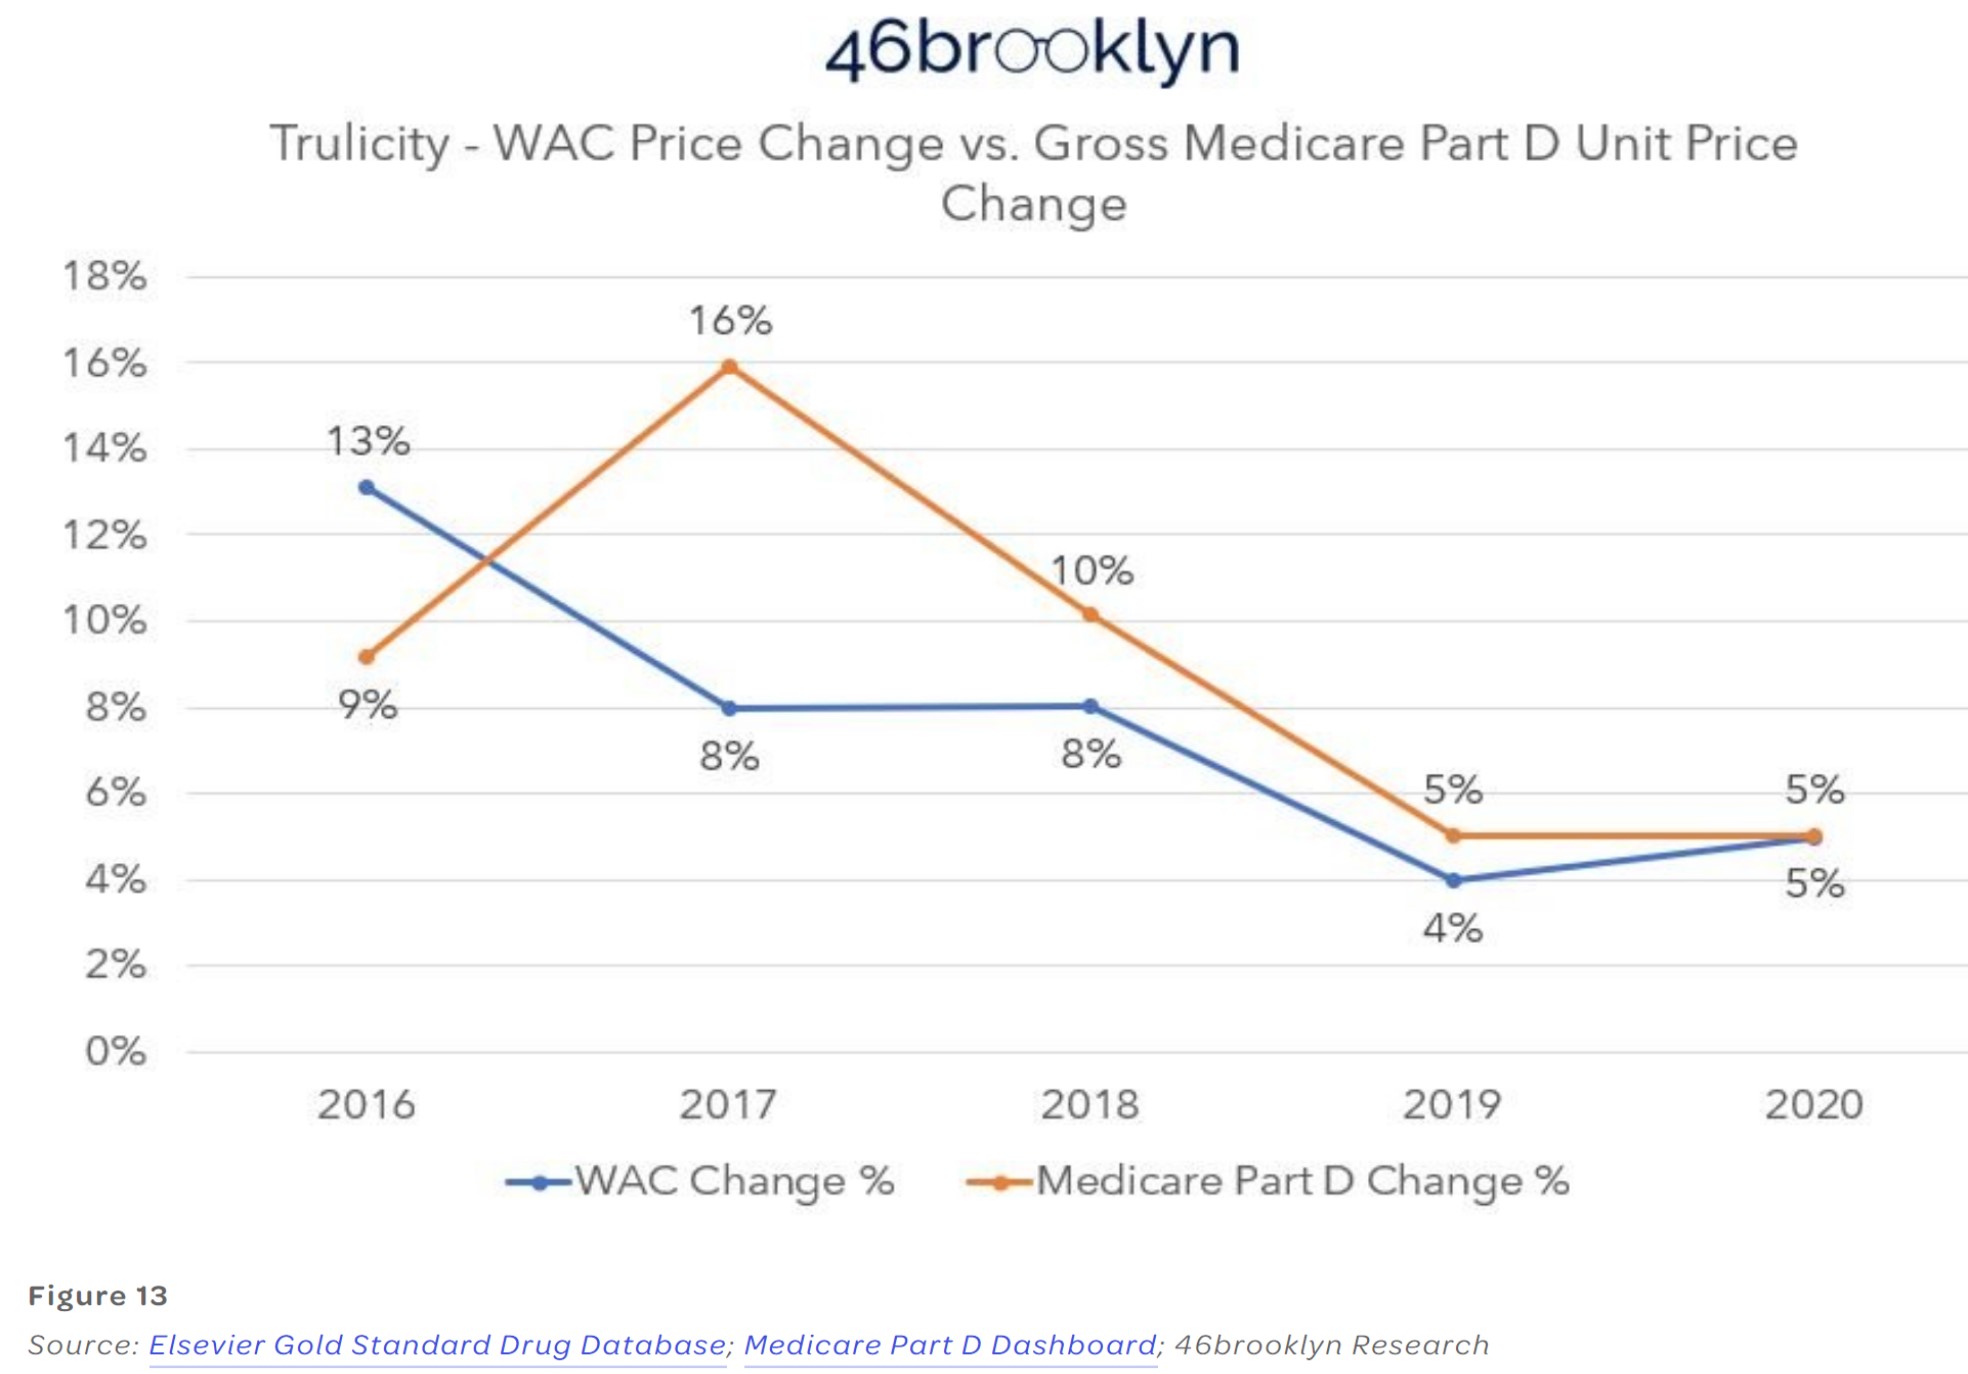
As explained, Trulicity (Figure 13). Medicare took double the price increase in 2017 than what the WAC price alone would tell us was appropriate. What gives? We were told the test was going to be easy. This is neither an easy or straightforward test of drug price cause and effect.
As PCMA (Pharmaceutical Care Management Association) would have us believe, there is one answer for who is responsible for drug affordability challenges: the drug manufacturer.
While the above pricing data trends do not support PCMA’s contention, 46Brooklyn is the first to acknowledge its analysis is subject to some limitations.
First, it’s obviously well worth noting 46Brooklyn admits it is analyzing list prices versus gross Medicare spend. Both subjects being severely impacted by massive discounts and concessions. (more on this in a later post). Negotiations behind the scenes, making actual pricing analyses more complex.
We have, as a nation, dedicated a lot of resource attempting to get drug pricing right. When you try and count the hours spent in legislative hearings (both at the state and federal level), alongside the amount of time by researchers (both academic and by the media) in studying this issue, the number gets very high. And all of this is before factoring the amount of time doctors, pharmacists, nurses, and patients spend trying to find affordable medications. According to our own website’s analytics, we collectively spent nearly 4,000 hours together just last year (2021) on the topic. Two thousand of you have tuned in to our podcast. Despite all that, complexity, misunderstanding, and dysfunction persists. A dysfunction that many players share responsibility in creating.
We present all of this to you today not in some full-throated defense of drug makers. Hardly. We proceed down this proverbial rabbit hole to showcase that drug pricing is far more complicated than some hope it to be, or perhaps more appropriately, far more complicated than some hope you’ll ever realize.
The truth is that we have an incredibly complex drug supply chain, a bevy of ways to quantify price, tremendous opacity, and more hidden nooks and crannies inside it than an English muffin factory. Every entity in the drug channel has a role in influencing and inflating the prices we pay for medicines. With what we learned – and continue to learn – in our home state of Ohio, PCMA and their members know better than to spread pricing fiction.
So how can it be that a CBO report formed the basis of a PCMA statement that the data we reviewed today doesn’t support? How can the argument be against measures to reduce drug costs. And are presented as this dichotomy between either securing lower premiums or recognizing lower drug costs? In what other forms of insurance does a cheaper service (i.e., lower drug cost) require a higher premium in order to cover the risk? Are there perhaps other CBO assessments that need recalibrated? Will the FTC end up being the Chosen One?
Try as we might, after all these years, we still don’t have all the answers. These are the types of questions keeping us up at night. Due to price because today, someone will go without the insulin they need because they can’t afford it. Someone else will forgo a school sport because they can’t afford the medication to control asthma. Someone else may not even give themselves a chance at beating cancer. They do not want to be a financial burden to their family in what will become their final days. Patients not taking a financial risk for a treatment with no guarantee to extend their life.
Glossary — 46brooklyn Research.
“Medicare hits $200 billion in gross drug spend: Who gets the blame?” 46brooklyn Research.
“Flash finding: How drug money from sick people really works,” 46brooklyn Research.
“Medicare Part D – Direct and Indirect Remuneration,” (DIR) | CMS.
“The Way Drugs Are Sold & Distributed Is Opaque, Inefficient, & Costly. Here’s How Companies Are Trying To Fix That,” (cbinsights.com).