This is a combination of two different posts. The first part is by the NCRC, the National Community Reinvestment Coalition. It offers up a wealth of detail expressed in numbers defining the issues confounding Native Americans. It is very brief and I would hope you follow the link to a larger array of statistics defining the issues. The second part is by the Economic Policy Institute. It is comparing the situation before the pandemic and after the pandemic. Conditions have worsened for Native Americans as the policies put in place have been cut back. Policymakers being Congress and efforts by Republicans. ~~~~~~~~ Introduction . . . Racial Wealth Snapshot: Native Americans, NCRC, Dedrick Asante-Muhammad, Esha Kamra, Connor Sanchez,
Topics:
Bill Haskell considers the following as important: Education, Journalism, Native Americans, politics, US EConomics
This could be interesting, too:
Robert Skidelsky writes Lord Skidelsky to ask His Majesty’s Government what is their policy with regard to the Ukraine war following the new policy of the government of the United States of America.
NewDealdemocrat writes JOLTS revisions from Yesterday’s Report
Joel Eissenberg writes No Invading Allies Act
Ken Melvin writes A Developed Taste
This is a combination of two different posts. The first part is by the NCRC, the National Community Reinvestment Coalition. It offers up a wealth of detail expressed in numbers defining the issues confounding Native Americans. It is very brief and I would hope you follow the link to a larger array of statistics defining the issues.
The second part is by the Economic Policy Institute. It is comparing the situation before the pandemic and after the pandemic. Conditions have worsened for Native Americans as the policies put in place have been cut back. Policymakers being Congress and efforts by Republicans.
~~~~~~~~
Introduction . . .
Racial Wealth Snapshot: Native Americans, NCRC,
Dedrick Asante-Muhammad, Esha Kamra, Connor Sanchez, Kathy Ramirez and Rogelio Tec
Poverty Rates
Based on the data from the 2018 US Census cited by Poverty USA, Native Americans have the highest poverty rate among all minority groups. The national poverty rate for Native Americans was 25.4%, while Black or African American poverty rate was 20.8%. Among Hispanics, the national poverty rate was 17.6%. The White population had an 8.1% national poverty rate during the same period.
Updated US Census Bureau data on poverty for 2019 and 2020 does not show Native Americans or Alaska Natives as a specific category, highlighting the continuous lack of information on this part of the US population. We do not know the full extent of their situation, but based on previous data, Native Americans have the highest rate of poverty in the nation.
Unemployment
According to the 2019 Bureau of Labor Statistics data, the unemployment rate for Native Americans was 6.1%. The unemployment rate for African Americans was also 6.1% while Hispanics had a 4.3% unemployment rate and Whites had a rate of 3.3%. In terms of employment, American Indians (including Alaska Natives) had a 57.1% employment-to-population ratio while African Americans had an employment-to-population ratio of 58.7%. White Americans had an employment-to-population ratio of 61% and Hispanics had the highest ratio at 63.9%. In both unemployment and employment, American Indians and African Americans are the most economically marginalized groups.
~~~~~~~~
A Deeper Dive . . .
Native American child poverty more than doubled in 2022 after safety net cutbacks: Child poverty rate is higher than before the pandemic, Economic Policy Institute,
Ismael Cid-Martinez and Stevie Marvin
Child poverty rate is higher than before the pandemic
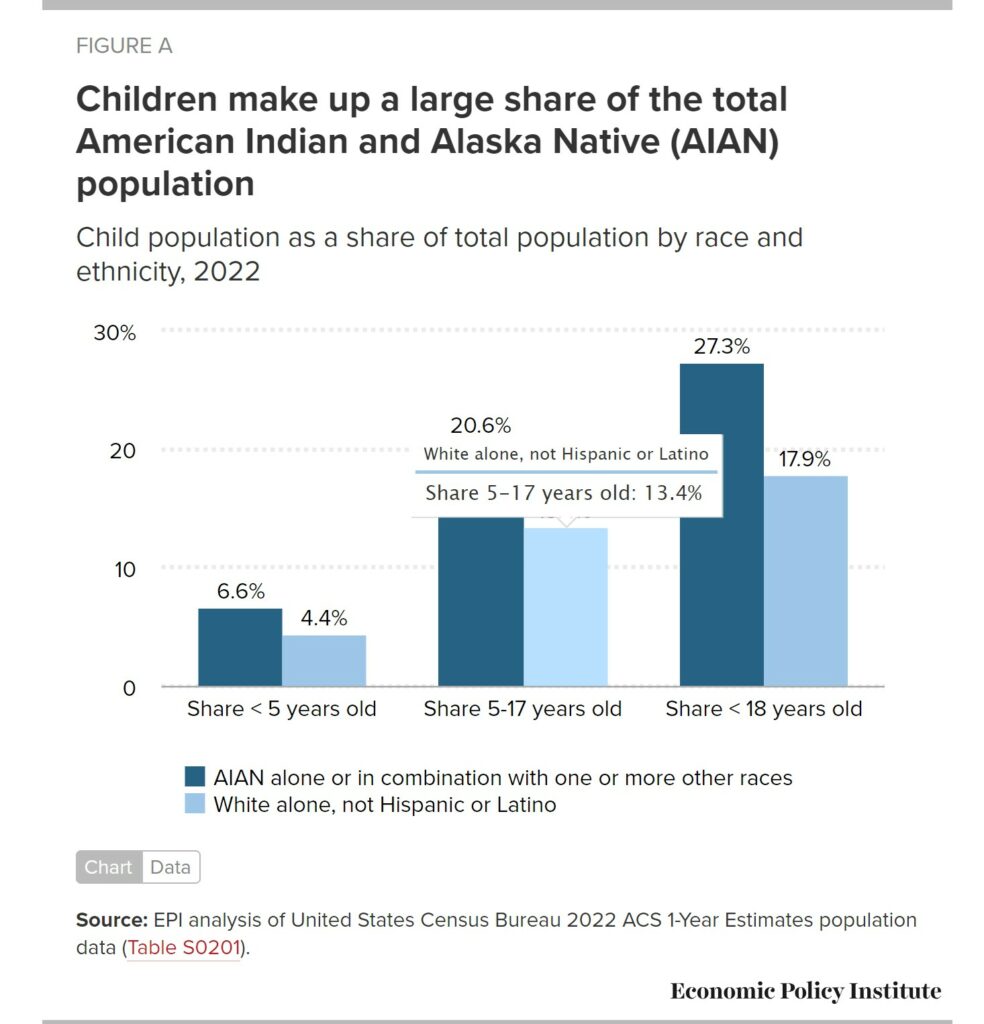
November, the U.S. observes National Native American Heritage Month. The commemoration celebrates the sovereignty, contributions, and resilience of tribal nations and Native people in the face of a violent, painful, and ongoing history.1 The enduring effects of colonialism, genocide, and state-sanctioned theft and violence continue to shape the socioeconomic outcomes of Native people. Today, the Native American community makes up a diverse and growing share of the U.S. population, with children accounting for more than one-quarter of the American Indian and Alaska Native (AIAN) population.2
Poverty increased sharply for AIAN children in 2022. Policymakers had allowed key economic relief measures to expire that helped families absorb the shock of the pandemic. Native American children have historically been painfully exposed to economic vulnerability. Structural inequities in the labor market and the broader economy continue to limit the earnings of AIAN families leaving workers in this community unfairly exposed to job losses.
Native Americans represent a diverse and growing share of the U.S. population
About 9.7 million people make up the AIAN population in the United States. The figure increase from 5.2 million in 2010 comes from growth across all major groups during the last decade. In part, because more Americans identify as multiracial/multiethnic. But even this is an underestimate, as the U.S. Census Bureau has acknowledged similar undercount rates for AIAN populations on reservations in 2010 and 2020.
Between 2010 and 2020, the Alaska Native alone population increased by 10.9% and the Alaska Native (alone or in any combination) population surged by 45.6%. Similarly, the American Indian alone population increased by 11.6%, while the alone or in any combination population almost doubled during this period. The growth of the Latin American Indian (alone or in any combination) population was even stronger. The differences in growth between AIAN populations that identify as AIAN alone, versus alone or in any combination, reflect the need to observe Native communities holistically. This is particularly true when broad population and economic statistics fail to account for the unique experience and rich diversity that characterize the Native American community.
The vitality of the U.S. Native American community is also reflected in its youth. Children under age 5, and those between the ages of 5 and 17, make up a larger share of the total AIAN population than children in the non-Hispanic white population (Figure A). Overall, children account for more than one-quarter of the total AIAN population, compared with less than one-fifth of the non-Hispanic white population. The general youth of the Native American community means that its economic welfare cannot be separated from the well-being of AIAN children.
After declining in 2021, poverty increased sharply for Native American children last year
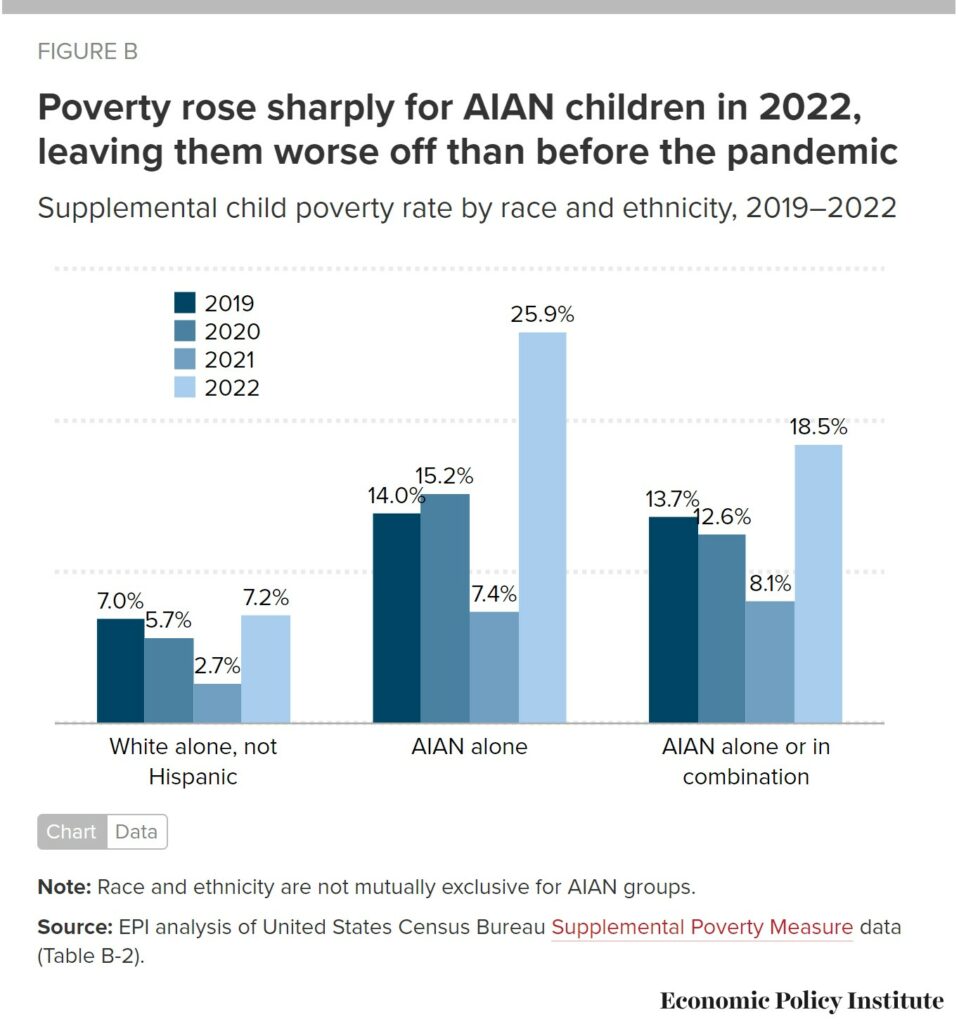
Native American families and children have historically been painfully exposed to poverty in the United States. Before the pandemic, for example, AIAN children were about twice as likely (13.7%) as their non-Hispanic white peers (7.0%) to suffer from economic deprivation below the poverty line (Figure B).
However, the poverty rate of AIAN children fell by 40% between 2019 and 2021 as a result of economic relief measures that included the temporary expansion of the Child Tax Credit. During this period, about 87,000 AIAN children were lifted out of poverty.
But Congress quickly allowed this progress to evaporate. The sunset of provisions that helped reduce economic suffering during the pandemic left AIAN families and children worse off in 2022 than before the pandemic. Between 2021 and 2022, the share of poor AIAN children more than doubled, and the share of AIAN (alone) children more than tripled. Nearly 1 in 5 (18.5%) AIAN children, and more than 1 in 4 (25.9%) AIAN alone children, fell below the supplemental poverty line in 2022.
Structural inequities leave AIAN families exposed to economic insecurity and poverty
Native American children’s experience with poverty is directly related to the structural inequities that reduce the economic security and well-being of their families. In 2022, for example, the typical AIAN household earned about 72 cents for every dollar of income earned by the median non-Hispanic white household. This gap was even steeper, 65 cents, for the typical AIAN alone household.
Further, AIAN workers are more likely to be out of work and searching for a job than their white peers. While the unemployment rate of AIAN (alone) workers continues to slowly rebound amid the strong labor market recovery, these workers remained about twice as likely as their white peers to be unemployed in October 2023. AIAN workers in AIAN or tribal areas often face even more limited employment prospects. Structural racism drives the historical persistence of these inequities.
AIAN workers stand to gain from legislative proposals that would raise the federal minimum wage and strengthen workers’ right to organize. But much more will be required to achieve economic equity for Native American families and children. The economic relief measures enacted in response to the pandemic proved that both child poverty and inequity are policy choices. Expanding the U.S. social safety net can once again help AIAN children and their families avoid economic insecurity. Recognizing the power of tribal self-determination, the federal government must also honor tribal nations’ sovereign right to inform the implementation of federal investments in infrastructure, manufacturing, and clean energy. All these measures could help pave the way for Native American families and children to escape the cycle of economic vulnerability left behind centuries of violence, theft, and unmet obligations.
Notes
1. Conscious of limitations, we use American Indian and Alaska Native interchangeably with Native American and Native community or people.
2. AIAN hereby refers to AIAN alone or in combination with other groups, unless specified otherwise.


