Consumer Price Index – July 2024 (bls.gov) The Consumer Price Index for All Urban Consumers (CPI-U) increased 0.2 percent on a seasonally adjusted basis, after declining 0.1 percent in June, the U.S. Bureau of Labor Statistics reported today. Over the last 12 months, the All items index increased 2.9 percent before seasonal adjustment. The index for shelter rose 0.4 percent in July, accounting for nearly 90 percent of the monthly increase in the All items index. The energy index was unchanged over the month, after declining in the two preceding months. The index for food increased 0.2 percent in July, as it did in June. The food away from home index rose 0.2 percent over the month, and the food at home index increased 0.1 percent. The index
Topics:
Bill Haskell considers the following as important: consumer price index, CPI, US EConomics
This could be interesting, too:
NewDealdemocrat writes JOLTS revisions from Yesterday’s Report
Bill Haskell writes The North American Automobile Industry Waits for Trump and the Gov. to Act
Bill Haskell writes Families Struggle Paying for Child Care While Working
Joel Eissenberg writes Time for Senate Dems to stand up against Trump/Musk
Consumer Price Index – July 2024 (bls.gov)
The Consumer Price Index for All Urban Consumers (CPI-U) increased 0.2 percent on a seasonally adjusted basis, after declining 0.1 percent in June, the U.S. Bureau of Labor Statistics reported today. Over the last 12 months, the All items index increased 2.9 percent before seasonal adjustment.
The index for shelter rose 0.4 percent in July, accounting for nearly 90 percent of the monthly increase in the All items index. The energy index was unchanged over the month, after declining in the two preceding months. The index for food increased 0.2 percent in July, as it did in June. The food away from home index rose 0.2 percent over the month, and the food at home index increased 0.1 percent.
The index for All items less food and energy rose 0.2 percent in July, after rising 0.1 percent the preceding month. Indexes which increased in July include shelter, motor vehicle insurance, household furnishings and operations, education, recreation, and personal care. The indexes for used cars and trucks, medical care, airline fares, and apparel were among those that decreased over the month.
The All items index rose 2.9 percent for the 12 months ending July, the smallest 12-month increase since March 2021. The all items less food and energy index rose 3.2 percent over the last 12 months and was the smallest 12-month increase in that index since April 2021. The energy index increased 1.1 percent for the 12 months ending July. The food index increased 2.2 percent over the last year.
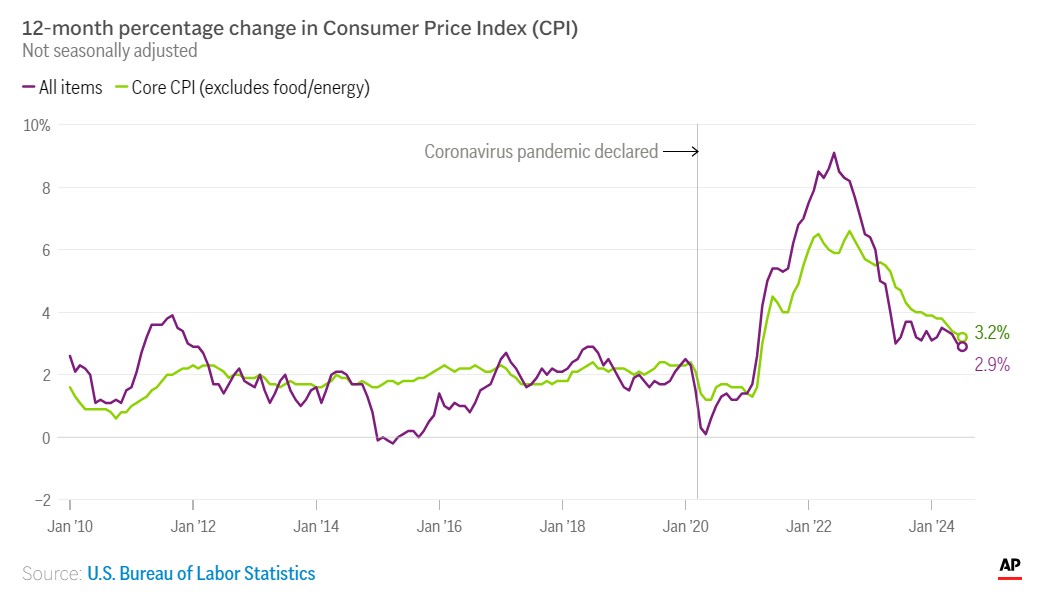
The graph above came from an AP article “US inflation slowed again in July, clearing way for Fed to cut rates, AP News” as taken from the Bureau of Labor Statistics. A fourteen year time span. Powell will hold out any changes for another month of two passes. Just in time for an election and people get laid off. This can go either way. We will have to see what New Deal democrat says.
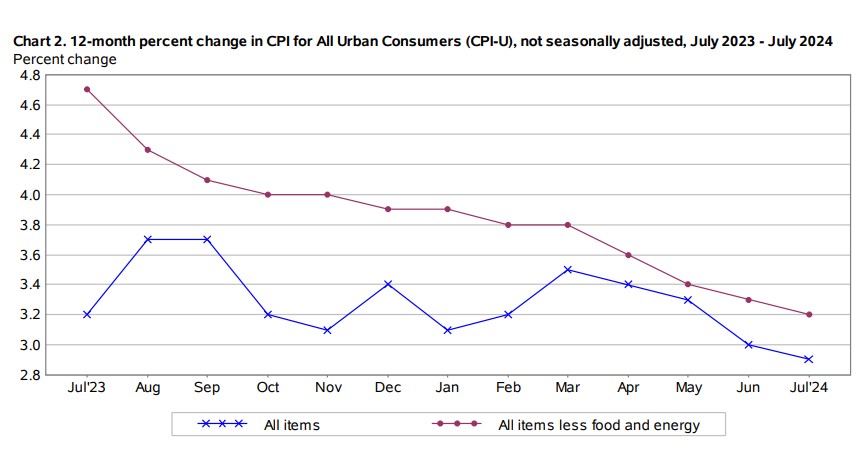
Similar chart above except looking back one year month by month to July 2023. Up close look at All items and All items less food and energy. Note the increases for All items.

AB: I like this CPI chart as it gives more detail to te items which were the Price leaders. Up close look goig back seven months,
Food
The food index increased 0.2 percent in July, as it did in June. The index for food at home rose 0.1
percent in July. Three of the six major grocery store food group indexes increased over the month while
the other three indexes declined in July. The index for meats, poultry, fish, and eggs rose 0.7 percent in
July as the index for eggs increased 5.5 percent. The fruits and vegetables index rose 0.8 percent over
the month and the nonalcoholic beverages index increased 0.5 percent.
The index for other food at home fell 0.5 percent in July, after rising 0.5 percent June. The cereals and bakery products index also decreased 0.5 percent over the month and the dairy and related products index declined 0.2 percent.
The food away from home index rose 0.2 percent in July, after rising 0.4 percent in each of the preceding two months. The index for limited-service meals rose 0.3 percent and the index for full service meals increased 0.1 percent over the month.
The index for food at home rose 1.1 percent over the last 12 months. The meats, poultry, fish, and eggs index rose 3.0 percent over the last 12 months and the nonalcoholic beverages index increased 1.9 percent. Over the same period, the index for other food at home rose 0.9 percent. The index for cereals and bakery products was unchanged over the last 12 months. In comparison, the fruits and vegetables index fell 0.2 percent over the year as did the dairy and related products index.
The index for food away from home rose 4.1 percent over the last year. The index for limited service
meals increased 4.3 percent over the last 12 months and the index for full-service meals rose 3.8 percent
over the same period.
Energy
The energy index was unchanged in July, after decreasing 2.0 percent in June. The gasoline index was
also unchanged over the month. (Before seasonal adjustment, gasoline prices rose 0.8 percent in July.)
The electricity index increased 0.1 percent over the month and the fuel oil index increased 0.9 percent.
The index for natural gas fell 0.7 percent in July.
The energy index increased 1.1 percent over the past 12 months. The index for electricity increased 4.9
percent over the last 12 months and the index for natural gas rose 1.5 percent. The gasoline index fell 2.2
percent over this 12-month span. The index for fuel oil fell 0.3 percent over the same period.
All items less food and energy
The index for all items less food and energy rose 0.2 percent in July, after rising 0.1 percent in June. The
shelter index increased 0.4 percent in July. The index for rent rose 0.5 percent over the month and the
index for owners’ equivalent rent increased 0.4 percent. The lodging away from home index rose 0.2
percent in July, after falling 2.0 percent in June.
The medical care index fell 0.2 percent in July, after rising 0.2 percent in June. The index for hospital
services fell 1.1 percent in July. The physicians’ services index and the prescription drugs index both
increased 0.1 percent in July.
AB: One could draw some conclusions from the numbers portrayed.