By KFF Pulled together data from KFF to get an idea of what is happening with US healthcare. Big issue is people do not know. Another issue is state’s resistance to enrolling people. Hope this helps . . . Recent data on monthly Medicaid disenrollments, renewals, overall enrollment and other key indicators. Figure 1 above . . . At least 20,104,000 Medicaid enrollees have been disenrolled as of April 11, 2024, based on the most current data from all 50 states and the District of Columbia. ~Thirty-one percent of people with a completed renewal were disenrolled in reporting states. Sixty-nine percent 69%, or 43.6 million enrollee’s coverage renewed (one reporting state does not include data on renewed enrollees). Data reported by states
Topics:
Bill Haskell considers the following as important: April 2024, Healthcare, Medicaid Tracker, politics, US EConomics
This could be interesting, too:
Robert Skidelsky writes Lord Skidelsky to ask His Majesty’s Government what is their policy with regard to the Ukraine war following the new policy of the government of the United States of America.
NewDealdemocrat writes JOLTS revisions from Yesterday’s Report
Joel Eissenberg writes No Invading Allies Act
Ken Melvin writes A Developed Taste
by KFF
Pulled together data from KFF to get an idea of what is happening with US healthcare. Big issue is people do not know. Another issue is state’s resistance to enrolling people. Hope this helps . . .
Recent data on monthly Medicaid disenrollments, renewals, overall enrollment and other key indicators.
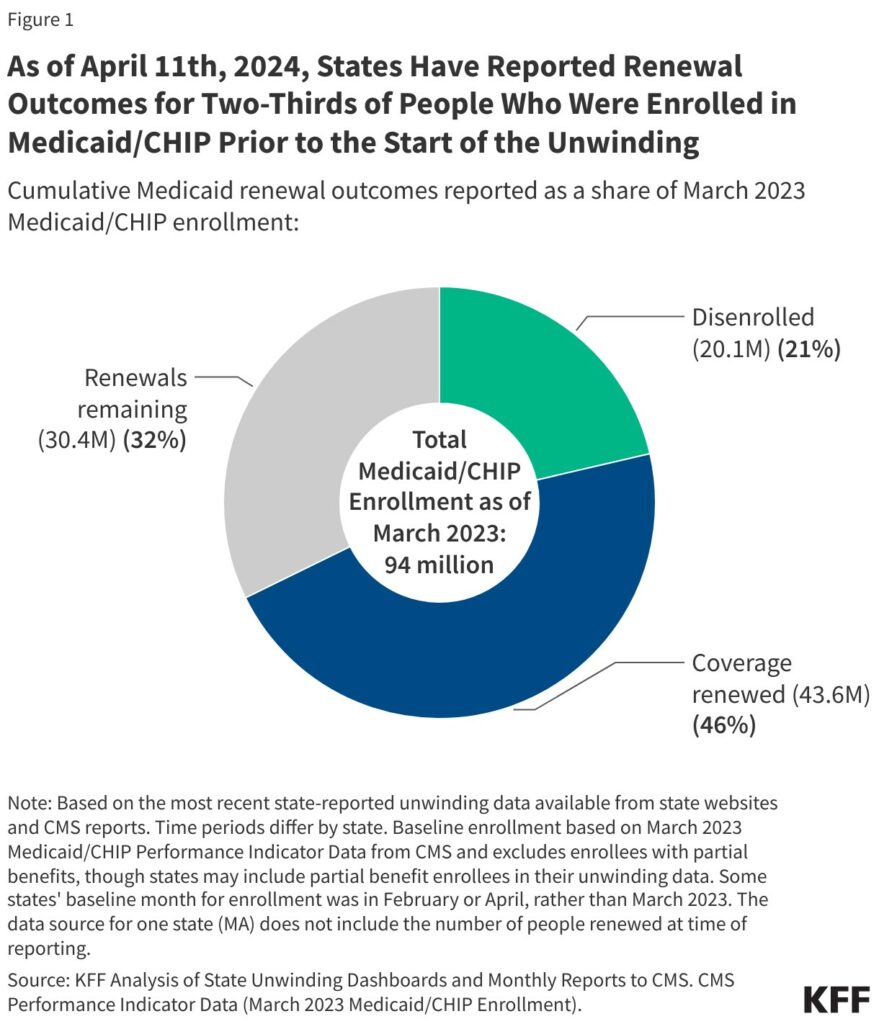
Figure 1 above . . .
At least 20,104,000 Medicaid enrollees have been disenrolled as of April 11, 2024, based on the most current data from all 50 states and the District of Columbia. ~Thirty-one percent of people with a completed renewal were disenrolled in reporting states. Sixty-nine percent 69%, or 43.6 million enrollee’s coverage renewed (one reporting state does not include data on renewed enrollees). Data reported by states during the unwinding of the Medicaid continuous enrollment provision. Varying lags for when states report data, may undercount the actual number of disenrollments to date.
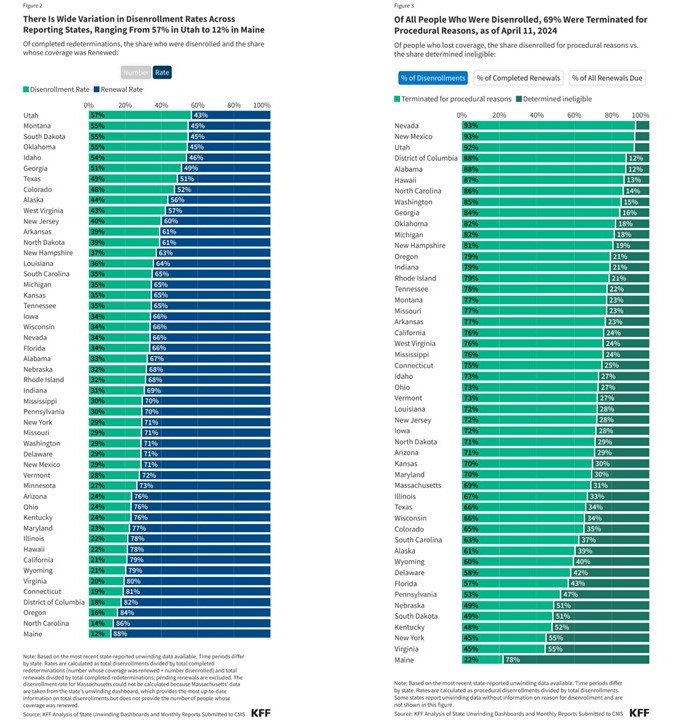
There is wide variation in disenrollment rates among reporting states. This ranges from 57% in Utah to 12% in Maine. Differences occur in who states are targeting with early renewals as well as differences in renewal policies and system capacity likely explain some of the variation in disenrollment rates.
Medicaid Disenrollments
Figure 2 below and to the left . . .
At Least 20,104,000 Medicaid Enrollees Have Been Disenrolled and 43,640,000 Have Had Their Coverage Renewed, as of April 11, 2024
Of completed redeterminations, the number of people disenrolled and the number of people whose coverage was renewed.
Across all states with available data, 69% of all people were disenrolled. Their coverage terminated for procedural reasons. However, these rates vary based on how they are calculated (see note below). Procedural disenrollments are cases where people are disenrolled because they did not complete the renewal process and can occur when the state has outdated contact information or because the enrollee does not understand or otherwise does not complete renewal packets within a specific timeframe. High procedural disenrollment rates are concerning because many people who are disenrolled for these paperwork reasons may still be eligible for Medicaid coverage. Some states have temporarily paused procedural terminations for some enrollees while they address problems in the renewal process that lead to increased procedural disenrollments.
Figure 3 above and to the Right (click to enlarge)
Of All People Who Were Disenrolled, 69% Were Terminated for Procedural Reasons, as of April 11, 2024
Of people who lost coverage, the share disenrolled for procedural reasons vs. the share determined ineligible.
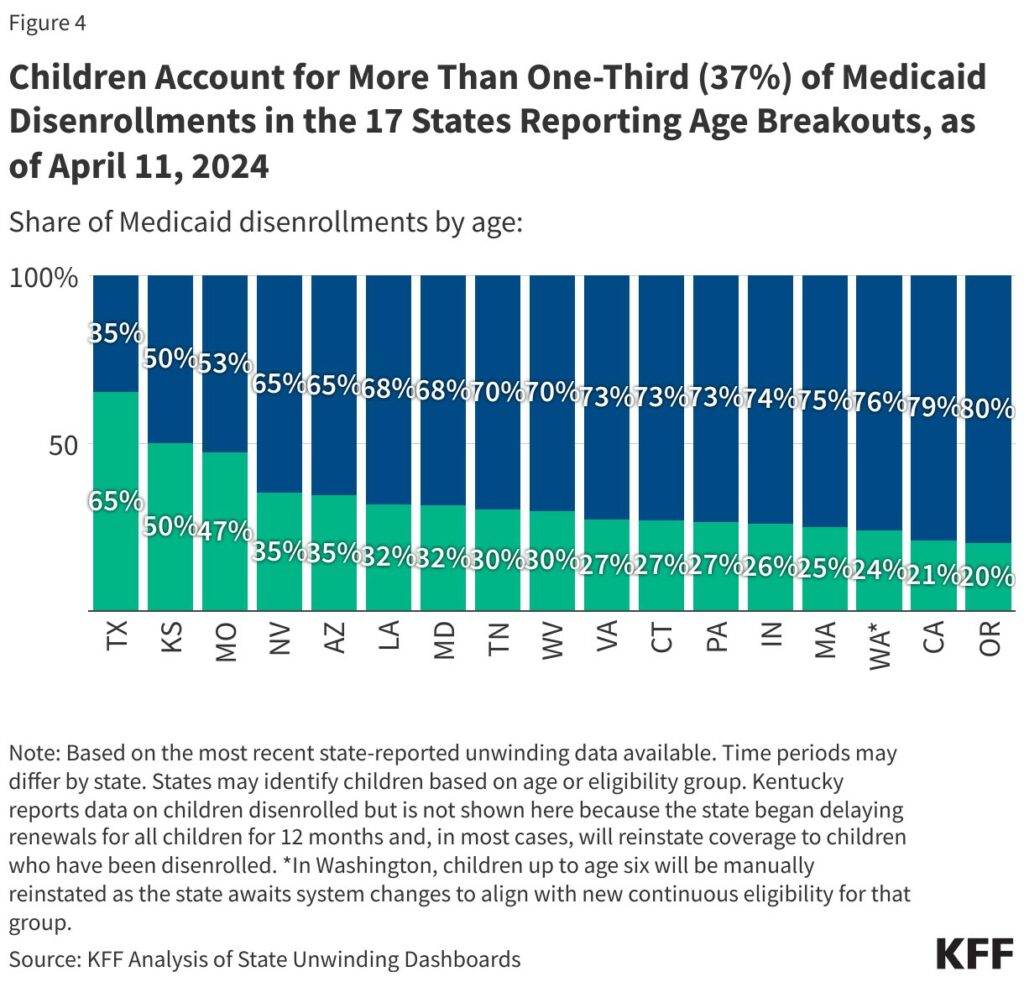
Medicaid Disenrollments of Children
Data for children is limited. Children did account for almost four in ten (37%) Medicaid disenrollments in the 14 states. This according to reporting age breakouts as of April 11, 2024. As many as 21 states reported disenrollments broken out by age. Some states have since stopped reporting. Texas has one of the largest Medicaid programs. Due to the limited number of states reporting, Texas has a disproportionate impact on the share of children disenrolled. (AB: lets face it, Texas is no shining beacon of light for the disadvantaged.) The share of children disenrolled ranged from 65% in Texas to 20% in Oregon.
Disenrolled from Medicare
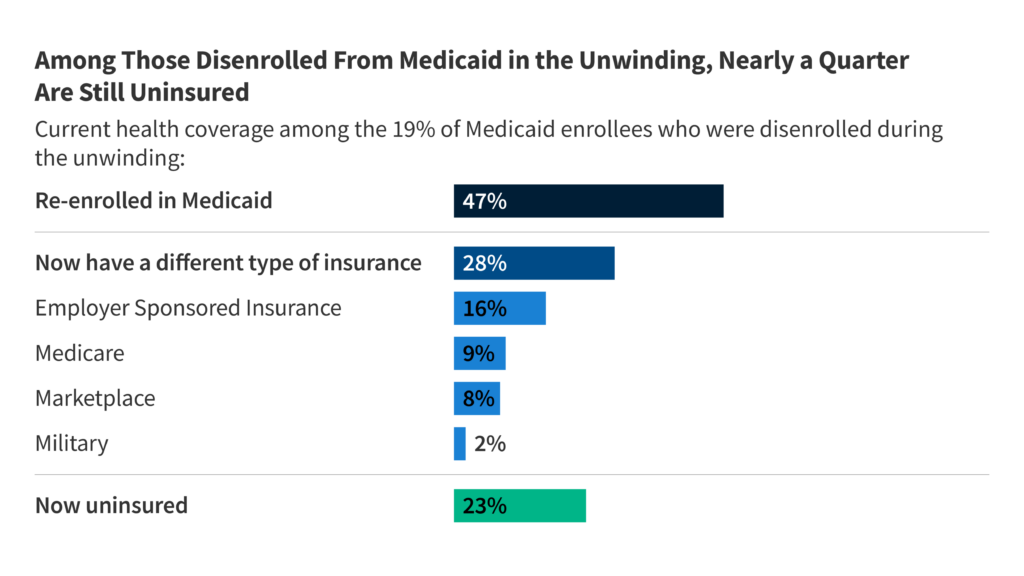
Graph above . . .
Nearly a quarter (23%) of adults who say they were disenrolled from Medicaid since early 2023 report being uninsured now, finds a new KFF national survey examining how the unwinding affected enrollees.
Overall, 19% of adults who had Medicaid prior to the start of unwinding say they were disenrolled at some point in the past year. Of this group, a large majority (70%) were left at least temporarily uninsured, while 30% already had another form of health coverage in place.
About half (47%) of those disenrolled say they subsequently re-enrolled in Medicaid, and more than a quarter (28%) now have another form of coverage—either through an employer, Medicare, the Affordable Care Act’s marketplace or health care for members of the military.
Nearly a Quarter of People Who Say They Were Disenrolled from Medicaid During the Unwinding Are Now Uninsured, KFF


