The Demographic Outlook: 2024 to 2054, Congressional Budget Office, January 2024 A difference approach to determining the population, the resulting projections, and outcomes as determined by the Congressional Budget Office. The Congressional Budget Office is describing its population projections, which underlie the agency’s baseline budget projections and economic forecast that have been published in already. This report provides the foundation for the later publication. For example, the size of the U.S. population, its age, and sex composition will have significant implications for the economy and the federal budget. I would look at this as being more of a forecast. A forecast which could be wrong and also result in faulty economic forecasts.
Topics:
Bill Haskell considers the following as important: CBO, population growth, US EConomics
This could be interesting, too:
NewDealdemocrat writes JOLTS revisions from Yesterday’s Report
Bill Haskell writes The North American Automobile Industry Waits for Trump and the Gov. to Act
Bill Haskell writes Families Struggle Paying for Child Care While Working
Joel Eissenberg writes Time for Senate Dems to stand up against Trump/Musk
The Demographic Outlook: 2024 to 2054, Congressional Budget Office, January 2024
A difference approach to determining the population, the resulting projections, and outcomes as determined by the Congressional Budget Office. The Congressional Budget Office is describing its population projections, which underlie the agency’s baseline budget projections and economic forecast that have been published in already. This report provides the foundation for the later publication. For example, the size of the U.S. population, its age, and sex composition will have significant implications for the economy and the federal budget. I would look at this as being more of a forecast. A forecast which could be wrong and also result in faulty economic forecasts.
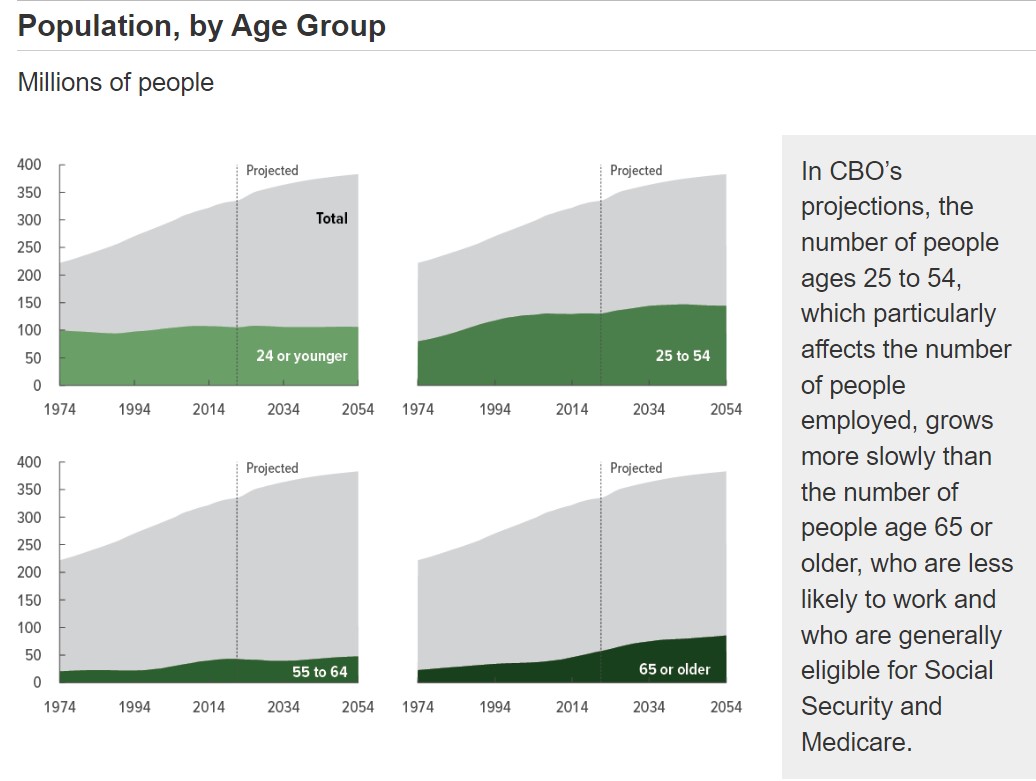
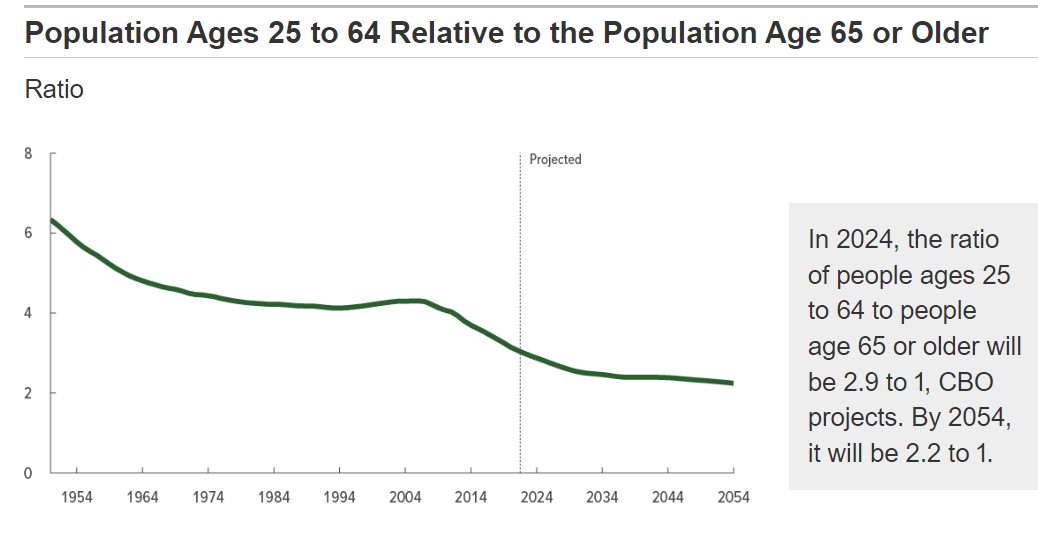
Population changes in the size of it, as well as its age and sex composition, affect the outlook for the economy and the federal budget. For example, the number of people who are employed and paying taxes on their wages depends on the size of the population ages 25 to 54. The number of beneficiaries of some federal programs (including Social Security and Medicare) depends on the size of the population age 65 or older.
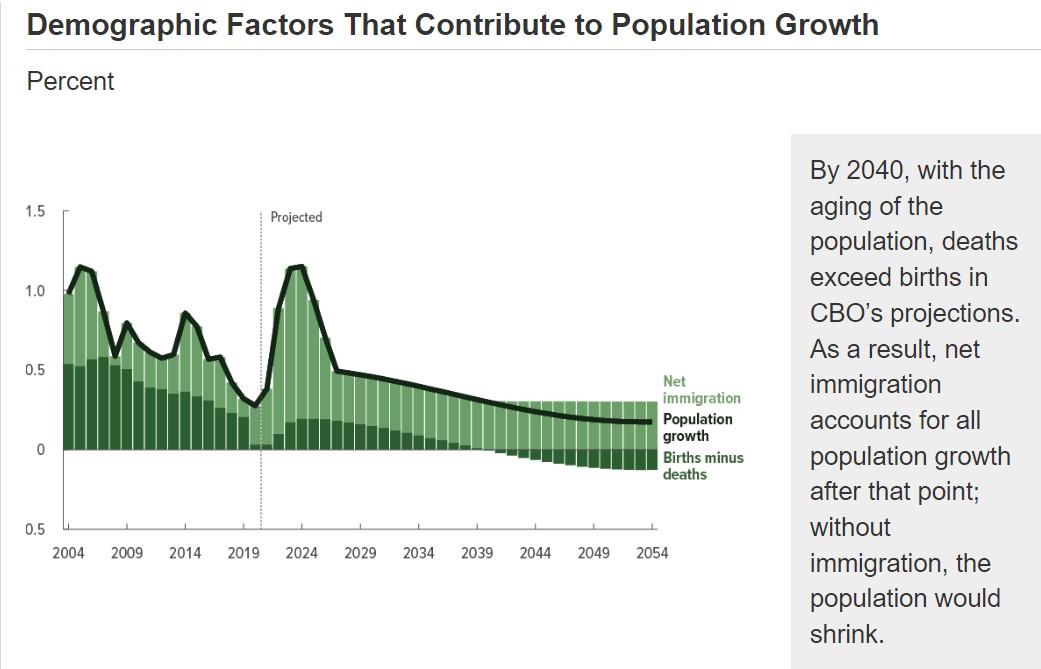
CBO’s projections, the population increases from 342 million people in 2024 to 383 million people in 2054, growing by 0.4 percent per year, on average. This is less than one-half the pace experienced from 1974 to 2023 (0.9 percent per year). Over the next decade, immigration accounts for about 70 percent of the overall increase in the size of the population. The greater number of births than deaths accounts for the remaining 30 percent. After 2034, net immigration increasingly drives population growth, accounting for all population growth beginning in 2040.
CBO’s population projections over the 2024–2054 period are uncertain, especially in later years. If rates of fertility, mortality, or net immigration are higher or lower than in the agency’s projections, the resulting population would differ from the amounts shown. The effects would be larger in later years of the projection period than in the earlier years because differences in those rates compound in each year of the period.
The Size and Age Composition of the Population
On Average, the population is projected to become older over the 2024–2054 period. In CBO’s projections, the number of people age 65 or older rises, and growth of it outpaces growth of younger age groups.
Components of Population Growth
Three aspects of population growth are births, deaths, and net immigration. In CBO’s projections, fertility rates remain lower than the replacement rate (the fertility rate required for a generation to exactly replace itself in the absence of immigration, or 2.1 births per woman). Mortality rates generally continue to decline. Immigration becomes an increasingly important part of overall population growth.
Fertility
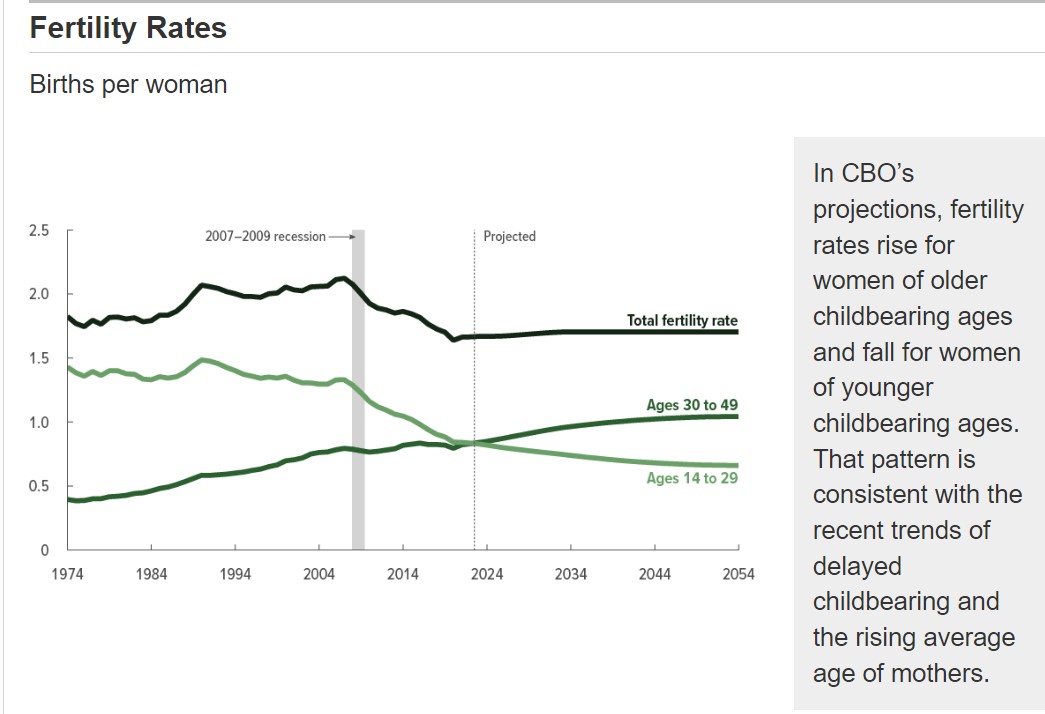
CBO projects fertility rates on the basis of its assessment of historical trends and other factors. On average and for the 20 years before the 2007–2009 recession, the total fertility rate was 2.02 children per woman. After peaking at 2.12 in 2007, the rate has generally fallen, and largely due to lower fertility rates amongst women ages 15 to 24.1 The rate equaled 1.64 births per woman in 2020 and rose to 1.67 in 2022 (the most recent year for which data were available when the projections were made).
In CBO’s projections, the total fertility rate remains at 1.67 births per woman through 2024, Then it rises as fertility rates increase among women ages 30 to 49. In CBO’s assessment, the increase in fertility rates occurs, at least in part, because some of the decline in fertility at younger ages stems from delayed childbearing. By 2034, the total fertility rate is projected to be 1.70 births per woman, where it remains through 2054.
CBO’s projections of fertility rates are subject to significant uncertainty. If trends in fertility, such as the delay in childbearing and the rising average age of mothers, differed from CBO’s projections, then the agency’s projections of overall fertility rates and the age distribution of mothers would change.
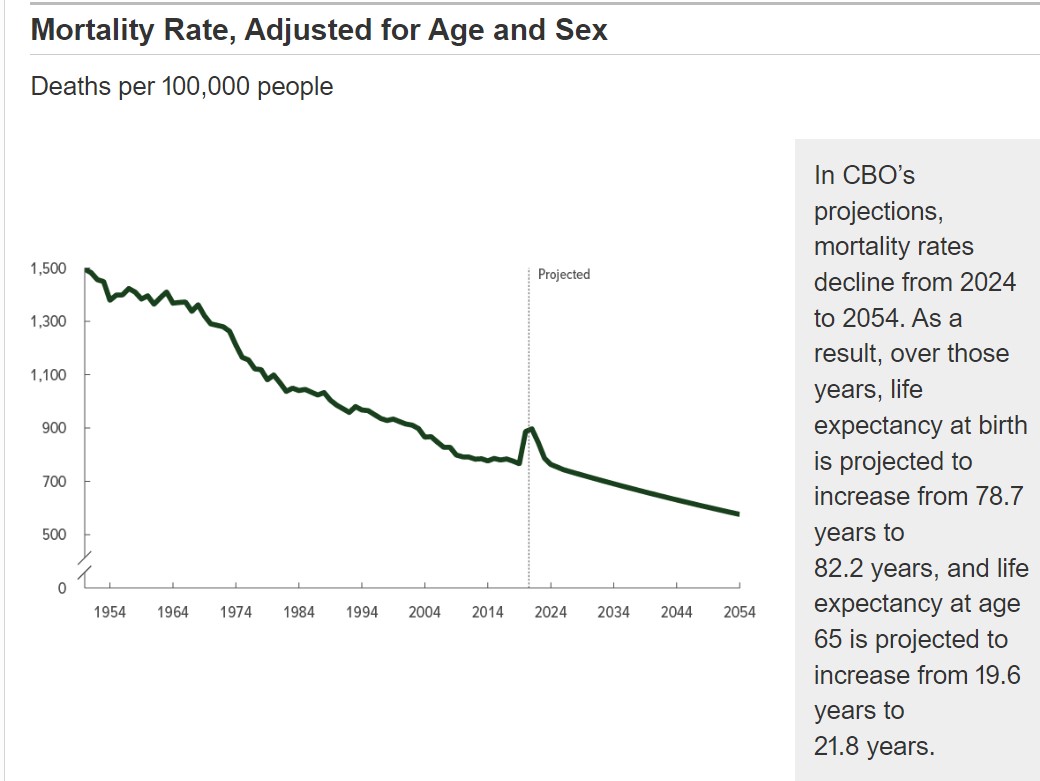
Mortality
CBO projects mortality rates on the basis of historical trends. The agency then takes into account the effects of COVID-19.
Since the early 20th century, mortality rates in the United States have generally decreased (meaning life expectancy has generally risen). Mortality rates have decreased more quickly for younger people than for older people. Since ~2010 though, the overall rate of decline has slowed. Although Mortality rates have increased for some groups, particularly younger people.
To account for those trends, CBO estimates mortality rates (calculated for five-year age groups and measured before including the effects of COVID-19). Mortality rates will change from 2021 to 2025 at roughly the same average rate they did for each age group from 2010 to 2019. After 2025, mortality rates are projected to return to longer-term trends and decline at a faster average rate than they did between 2010 and 2019. After 2025, CBO projects mortality rates will decline at the average rate they declined over the entire 1950–2019 period. The average incorporates both the period of faster decline before 2010 and the period of slower decline and a reversal some groups experienced between 2010 and 2019. The net effect is a continued decline in mortality rates.
After projecting mortality rates on the basis of historical trends, CBO incorporated the effects of COVID-19 on mortality rates through 2025 by increasing those rates. The increase especially for older people (who are more likely to die from Covid). Although COVID-19 was a leading cause of death in recent years, in CBO’s projections the long-term trend of declining mortality rates continues and more than offsets the projected effects of COVID-19 in the surviving and future populations. Consequently, life expectancy at birth and at age 65 increases.
Mortality rates in the long term are uncertain because factors such as the evolution of medical technology and environmental conditions may have different effects in the future than they have had in the past. It is also uncertain how long the recent slowdown in the decline of the mortality rate will continue.
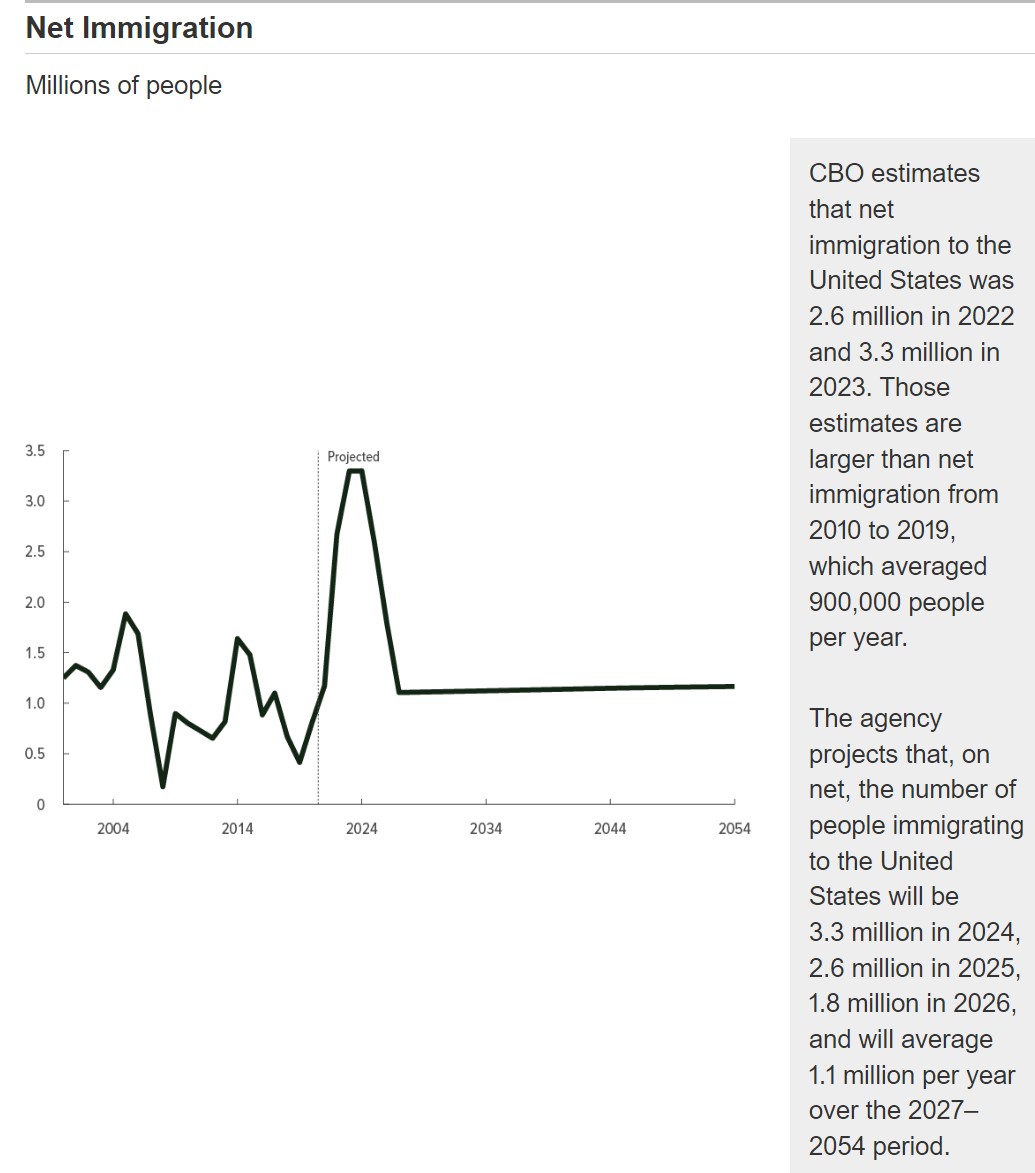
Net Immigration
For the first two decades of the projection period (2024 to 2044), CBO’s estimates of net immigration (the number of people who enter the United States in a given year minus the number who leave in that year) are based on the agency’s assessment of recent trends in immigration. After 2044, net immigration in a given year is projected to grow at roughly the same rate as projected population growth in the previous year—0.2 percent per year, on average.
CBO develops its projections so that they fall in the middle of the likely range of outcomes without new legislation. Several factors contribute to the uncertainty of CBO’s projections of net immigration. For example, changing conditions in immigrants’ countries of origin could significantly affect outcomes. In addition, estimates and projections of net immigration of people who enter the United States illegally are particularly uncertain because information about that group is hard to obtain and difficult to assess when available.
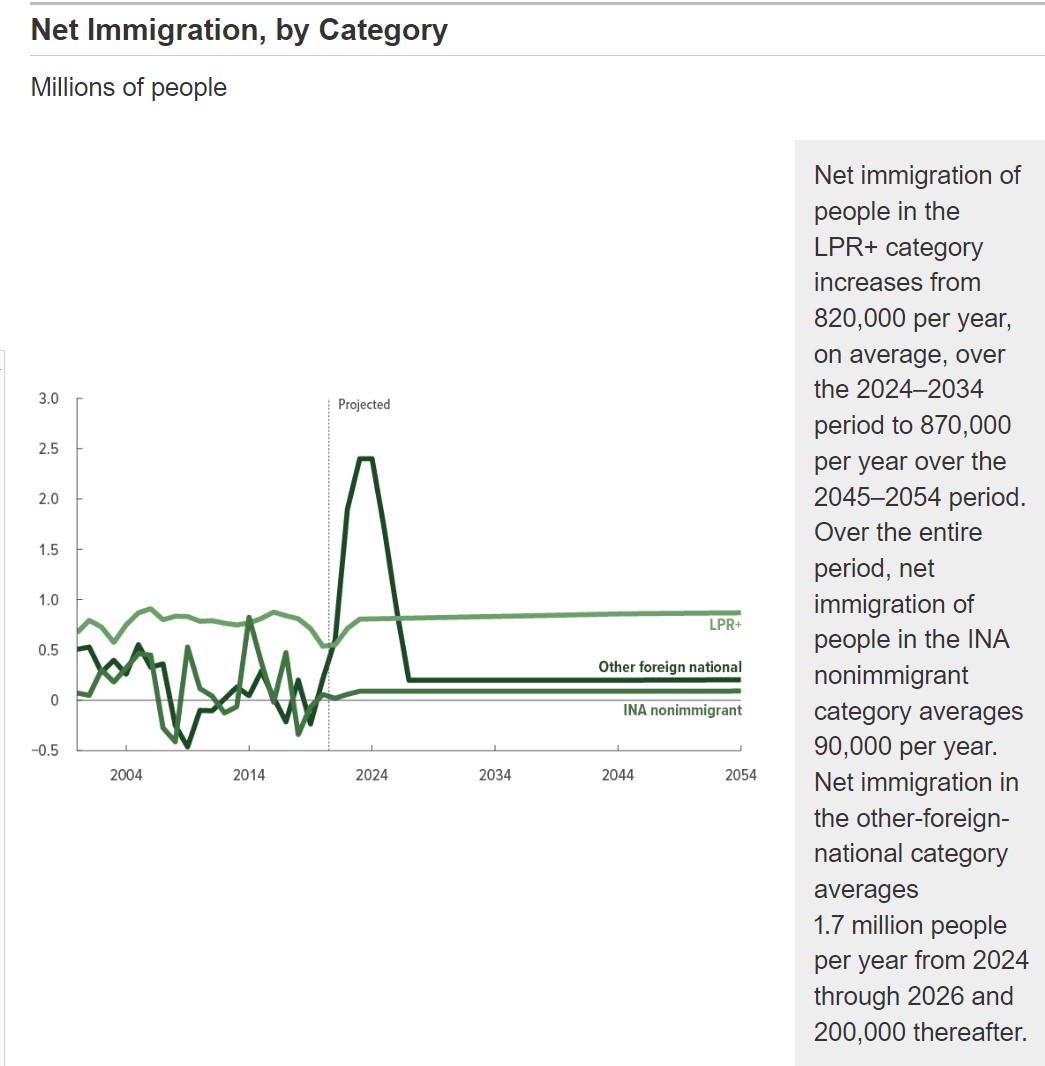
Net Immigration, by Category
To develop its projections of net immigration, CBO groups people into three categories (see Appendix C):
- The LPR+ category includes lawful permanent residents (LPRs) plus people who are eligible to apply to become LPRs on the basis of their current status, such as asylees (already in country) and refugees.
- The INA nonimmigrant category refers to people admitted as nonimmigrants under the Immigration and Nationality Act (INA), including students and temporary workers.
- The other-foreign-national category consists of people in the United States who are not in the first two categories. They have not subsequently become U.S. citizens or received LPR, asylee, or nonimmigrant status. Such people may have entered the United States illegally and also people who were permitted to enter through the use of parole authority and who may be awaiting proceedings in immigration court.
In CBO’s projections, total net immigration from 2024 to 2026 is larger than it was in the past. This is primarily reflecting the agency’s assessment the net immigration of people in the other-foreign-national category in 2024 will be similar to what CBO estimates it was in 2023 (see Appendix B). Then it will decline in 2025 and 2026 as the immigration system adjusts (without new legislation) to the increase in immigration. After 2026, net immigration of other foreign nationals returns to a number closer to historical levels. The decline in net immigration between 2024 and 2026 may stem from changes in decisions by other foreign nationals to enter or leave the United States, changes in actions by the Administration or immigration judges, or a combination of those changes.
The Budget and Economic Outlook: 2024 to 2034 | Congressional Budget Office, February 7, 2024