Let’s compare apples to apples here. Originally Published at Wealth Economics Uncle Joe has thrown out this 8.2% figure a couple of times, including in last night’s SOTU. Multiple folks have unpacked it; it’s not the standard “tax rate” measure. The usual “tax rate” is taxes divided by personal income, which doesn’t include accrued holding gains. The alternative that Joe’s using is based on Total “Haig-Simons” income, which does include holding gains. Economists for many decades have been referring to H-S income as the “preferred” income measure, because it actually explains changes in households’ balance-sheet assets. Personal income, and thus Personal saving, don’t even come close to explaining households’ asset accumulation, and
Topics:
Steve Roth considers the following as important: Taxes/regulation, US EConomics
This could be interesting, too:
NewDealdemocrat writes JOLTS revisions from Yesterday’s Report
Bill Haskell writes The North American Automobile Industry Waits for Trump and the Gov. to Act
Bill Haskell writes Families Struggle Paying for Child Care While Working
Joel Eissenberg writes Time for Senate Dems to stand up against Trump/Musk
Let’s compare apples to apples here.
Originally Published at Wealth Economics
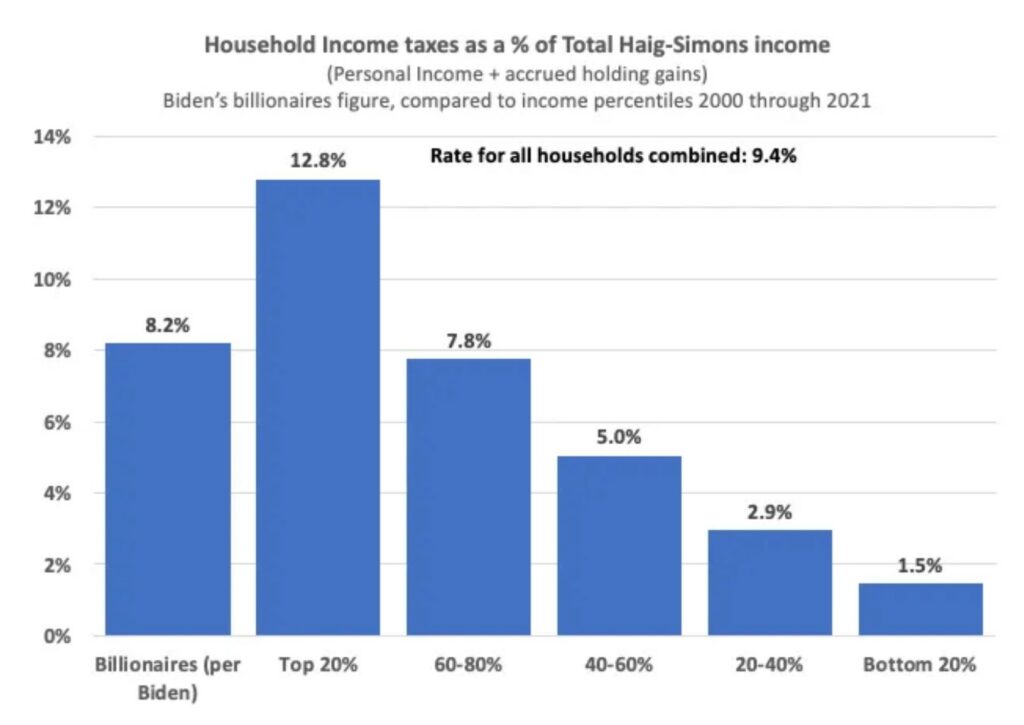
Uncle Joe has thrown out this 8.2% figure a couple of times, including in last night’s SOTU. Multiple folks have unpacked it; it’s not the standard “tax rate” measure. The usual “tax rate” is taxes divided by personal income, which doesn’t include accrued holding gains.
The alternative that Joe’s using is based on Total “Haig-Simons” income, which does include holding gains. Economists for many decades have been referring to H-S income as the “preferred” income measure, because it actually explains changes in households’ balance-sheet assets. Personal income, and thus Personal saving, don’t even come close to explaining households’ asset accumulation, and increasing wealth.
So Joe is using billionaires’ taxes as a percent of their Total income. Let’s do the same for other households.
Takeaways: The billionaire rate is badly regressive compared to the top quintile of income recipients. It’s somewhat regressive compared to the all-households rate. It starts looking actually progressive below the 60% mark.
I encourage my gentle readers to…do what you will with these figures. Have your way with ’em.

