This is really, really Rich . . . Nick Sandmann, high school junior who faced off with Native American elder Nathan Phillips on the Lincoln Memorial steps is suing WaPo for $250 million. It is “only the beginning said attorneys Lin Wood and Todd McMurtry, on their firm’s website, noting that it was the ‘first lawsuit’ on Sandmann’s behalf.” The Nathan Phillips MAGA smirker “video went viral in January as multiple groups collided after Sandmann attended...
Read More »Damn Socialists, Commies, and Libruls
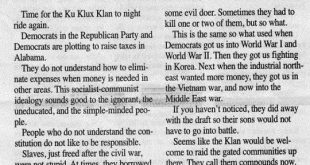
In an editorial, the publisher of the Democrat-Reporter newspaper in Linden Alabama confirmed to the Montgomery Advertiser on Monday that he authored the Feb. 14 editorial calling for the return of a white supremacist hate group. In a conversation, Goodloe Sutton added to the editorial. “If we could get the Klan to go up there and clean out D.C., we’d all been better off.” Asked to elaborate what he meant by cleaning up D.C., Sutton suggested lynching....
Read More »Open thread Feb. 19, 2019
Another Question for the Census
Another Question for the Census The Trump gang has kicked up a ruckus over its plan to insert a question about citizenship in the 2020 decennial census. It’s a transparent attempt to reduce the response rate of immigrants, disenfranchising them in reapportionment and government spending formulas, despite the Constitution’s call for an enumeration of “persons”, not citizens. But why stop at citizenship? When you think about, there is no government...
Read More »Kapernick
It was September 2017, and bad boy Trump spouts off; “Wouldn’t you love to see one of these NFL owners, when somebody disrespects our flag, to say, ‘Get that son of a bitch off the field right now, out,’” He’s fired. He’s fired!’” The crowd of supporters erupted in cheers. With just a few words and by the close of that weekend, Trump had managed to get hundreds of NFL players taking a knee like Kaepernick or staying in the locker room during the playing...
Read More »It’s Presidents Day, and we’re still basically flying blind on the economy
It’s Presidents Day, and we’re still basically flying blind on the eoncomy Not only are the markets closed today for President’s Day, but this entire week is about the emptiest I can ever recall for economic data. Literally the only data of note is going to be released on Thursday, and except for weekly jobless claims, even that is not what I would generally consider first-order metrics. Even worse, we are still basically flying blind due to the...
Read More »More signs of a slowdown: initial claims and real retail sales
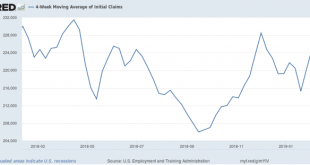
More signs of a slowdown: initial claims and real retail sales We got two negative data points. One is cause for concern; the other – not quite yet. Let me start with the “not yet” first. Initial jobless claims rose 4,000 to 239,000. That means that the 4 week moving average rose to 231,750: This means that the number is both higher YoY, and 12.5% above its 206,000 low in September. Ordinarily that would be cause for concern. BUT, the biggest factor in...
Read More »The Wrongness of the Green Lanthern Theory of the Presidency
Just one of the many mixes of comments and publications I see at AB in the comments sections. Not sure where EMichael got the Goldwater comment. “What’s wrong with the Green Lantern Theory of the Presidency? Basically, it denies the very real (and very important) limits on the power of the American presidency, as well as reduces Congress to a coquettish collection of passive actors who are mostly just playing hard to get. The Founding Fathers were...
Read More »The 2017 GOP tax scam may hurt the economy this spring
by New Deal democrat The 2017 GOP tax scam may hurt the economy this spring It turns out that part of the GOP tax scam of 2017 might hurt the economy this year. That’s because the total decline in the amount of tax refunds going to tax filers this looks like it is going to be enough to affect consumer spending significantly this spring. This post is up at Seeking Alpha. Special bonus: a few RW commenters there really don’t seem to like it!...
Read More »Amazon defeated in New York UPDATED
Amazon defeated in New York UPDATED In the biggest ever defeat for a subsidized project in history, Amazon announcedFebruary 14th that it was canceling its planned half of HQ2 for New York City, which was to receive subsidies worth at least $3.133 billion. After facing months of public opposition, the company provided a Valentine’s Day present in the form of capitulation. Amazon showed that, like Electrolux, its efforts to extract maximum subsidies from...
Read More » The Angry Bear


