In 2019 the age-adjusted death rate from an opioid overdose was 21.6 per 100,000 people. This compares with 12.9 for kidney disease, 14.2 from suicides, 14.7 for influenza, 21.6 from diabetes, and 161.5 from heart disease (the leading cause of death in the United States). Opioid overdose deaths place in the top 10 leading causes of death in the United States. As can been from Figure 1, prior to 2015 most of these opioid deaths arose from prescription (Rx) overdoses, but after that they came from synthetic opioids; in particular, fentanyl. …The overdose death rate was much higher for those without a college degree compared with those who had one. The rise in the death rate from synthetic opioids is particularly marked for the non-college educated population. That is from The Downward
Topics:
Chris Blattman considers the following as important: drugs, Economics, health, opioids, Research, United States
This could be interesting, too:
Lars Pålsson Syll writes Schuldenbremse bye bye
Lars Pålsson Syll writes What’s wrong with economics — a primer
Lars Pålsson Syll writes Krigskeynesianismens återkomst
Lars Pålsson Syll writes Finding Eigenvalues and Eigenvectors (student stuff)
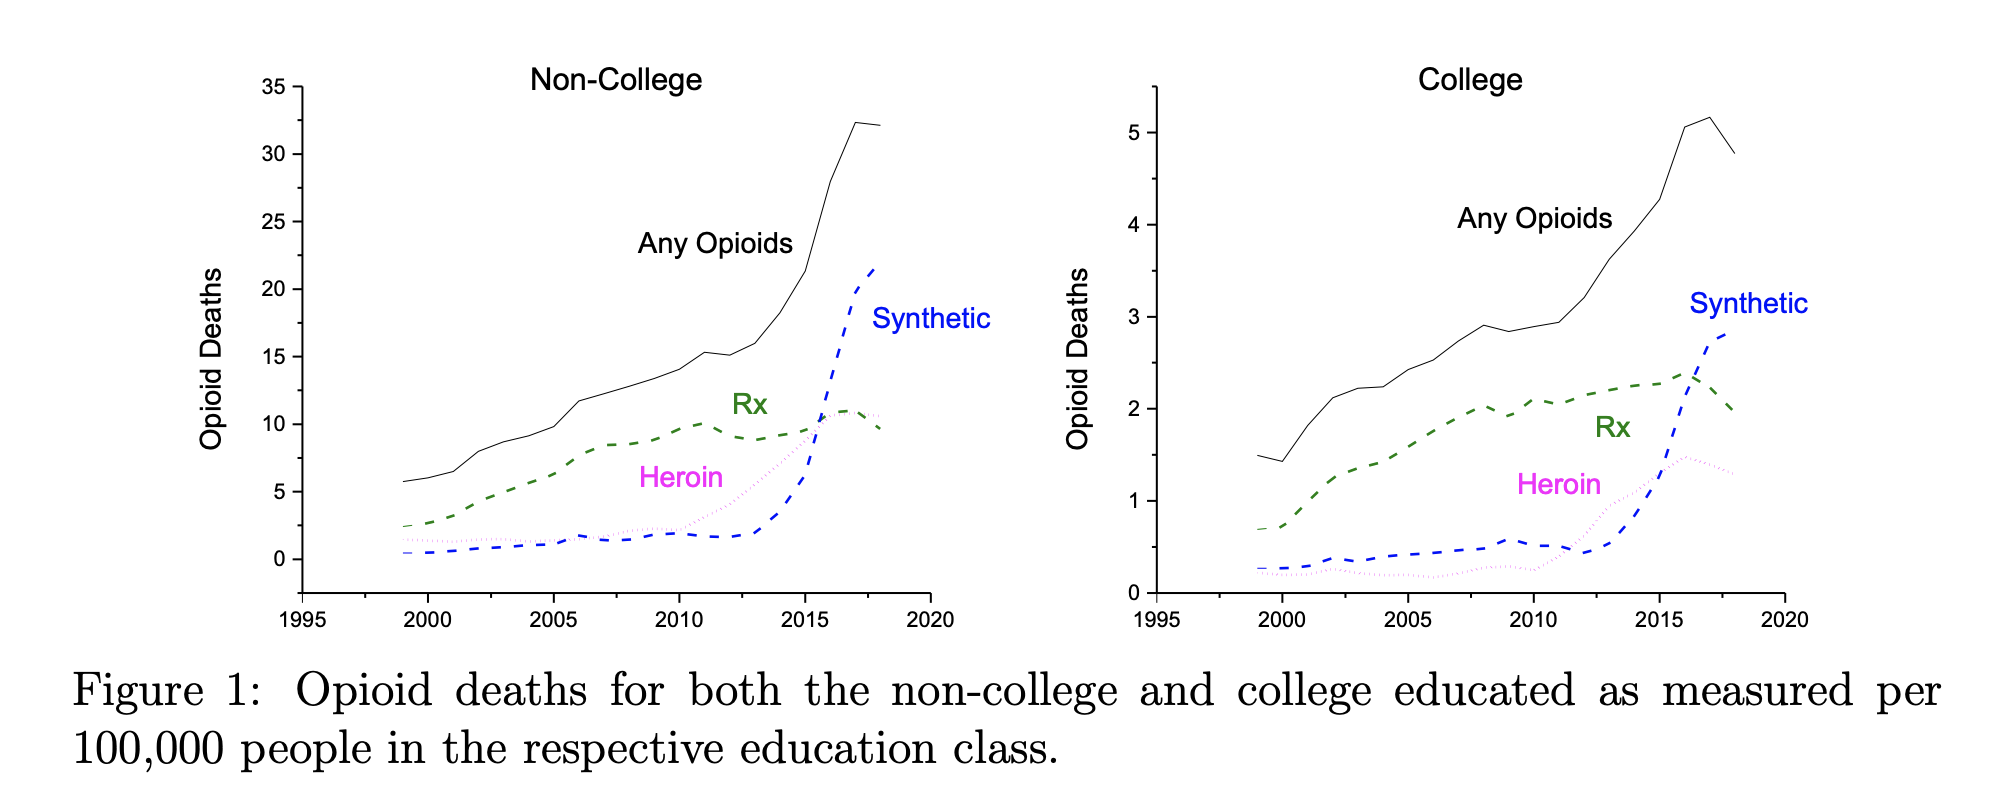
In 2019 the age-adjusted death rate from an opioid overdose was 21.6 per 100,000 people. This compares with 12.9 for kidney disease, 14.2 from suicides, 14.7 for influenza, 21.6 from diabetes, and 161.5 from heart disease (the leading cause of death in the United States). Opioid overdose deaths place in the top 10 leading causes of death in the United States.
As can been from Figure 1, prior to 2015 most of these opioid deaths arose from prescription (Rx) overdoses, but after that they came from synthetic opioids; in particular, fentanyl. …The overdose death rate was much higher for those without a college degree compared with those who had one. The rise in the death rate from synthetic opioids is particularly marked for the non-college educated population.
That is from The Downward Spiral, a new paper by Jeremy Greenwood, Nezih Guner, and Karen Kopecky.
While the article is about estimating mathematical models of opioid use, it has an amazing introduction and overview of the problem. It starts with some history.
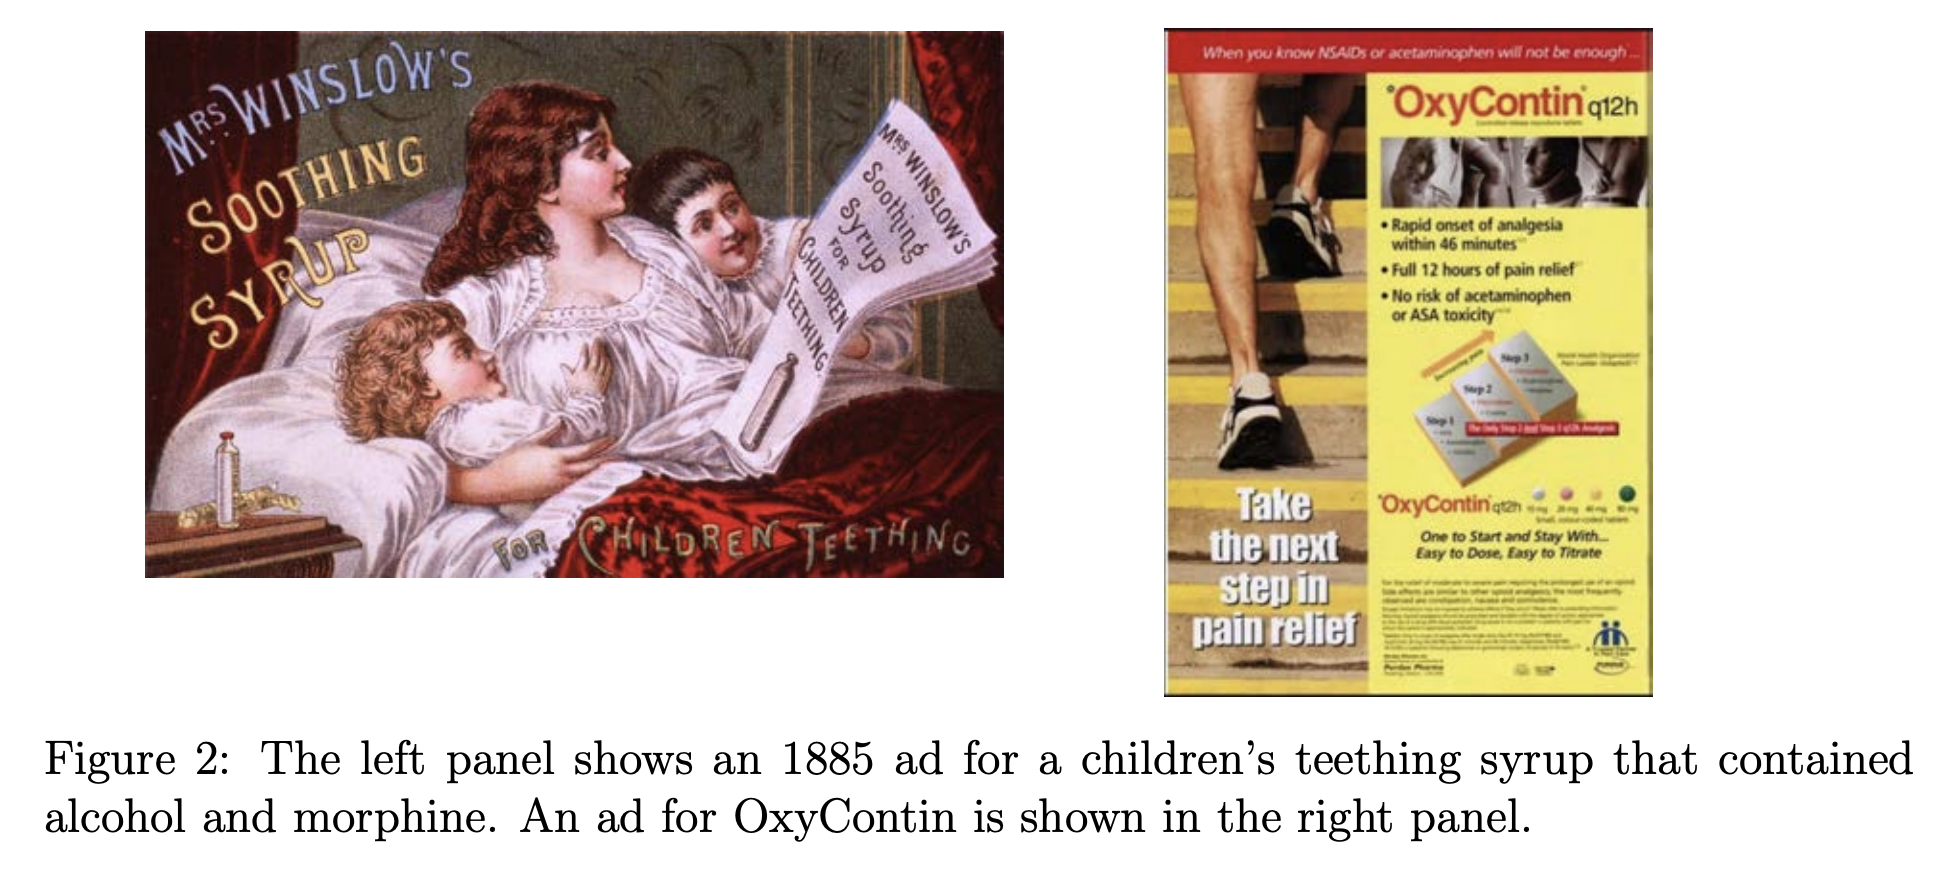
this is not the first opioid epidemic in the United States. Morphine was distilled from opium in 1804 by the German chemist F.W.A. Serturner. Merk started selling it in 1827. In the later part of the 19th century, opium and morphine were widely available in United States. Morphine was used in the Civil War to control the pain suffered by soldiers. Based on surveys of pharmacists and physicians, maintenance records for addicts, military medical examinations, and opiate imports, Courtwright (2001) estimates that there were 0.72 addicts per 1,000 population in 1842 and perhaps as much as 4.59 in the 1890s.
…The root of most morphine addictions in the late 1800s was prescriptions by physicians. The modal addict was a middle/upper-class, 37-year-old, white housewife. While morphine was routinely prescribed for a wide range of ailments, it was used for women’s health issues such as dysmenorrhea and afflictions such as anxiety/depression and headaches that disproportionately affect women. Aspirin wasn’t invented until 1899. Morphine might have been a substitute for alcohol since it was unfitting at the time for a woman to drink. Figure 2 displays an ad for a children’s teething pain formula that contained morphine. Addiction was viewed as such a problem that the US Congress passed the Harrison Narcotics Act in 1914 to control the distribution of opioids. Heroin was introduced as a cough suppressant in 1898. In the early 1900s the prototypical heroin addict was a lower-class white male in his early twenties.
For what launched the current epidemic, there are a huge number of candidate explanations.
Protracted pain diminishes the value of life. In the 1990s physicians rethought the need to manage pain. This led to the view that doctors were under prescribing pain killers, such as morphine, epitomized by a 1990 article in Scientific American titled “The Tragedy of Needless Pain.”
…Drug companies moved onto the new landscape. In 1996 Purdue Pharma introduced OxyContin with an aggressive marketing campaign. “Oxy” came from the opioid-based painkiller oxycodine and “Contin” meant continuous.
…Starting around the year 2000 there was a dramatic increase in number of opioid prescriptions per person for both the college- and non-college-educated populations. …The non-college educated were much more likely to have an opioid prescription than the college educated. The former often work in occupations involving physical labor. Additionally, the amount of Rx opioids consumed, conditional on a prescription, also rose. Again, this was particularly true for those without a college degree.
The price of prescription opioids has fallen dramatically since 2000. …This has been attributed to two factors. First, the advent of generic prescription opioids. Second, the expansion of social programs such as Medicare and Medicaid that subsidized the purchase of opioids… For the college educated Medicaid is less important than private payers while for the non-college educated the reverse is true. The share of opioids prescriptions funded by the government grew from 17 percent in 2001 to 60 percent in 2010. The vast majority of opioids went to people who needed relief from pain caused by either disability or illness.
Over the same period the street price of opioids dropped by a factor of 3. This has been chalked up to both the illegal imports of inexpensive powerful synthetic opioids, for example fentanyl, from China and elsewhere. Additionally, the diversion of opioids from legal sources onto the black market via fraudulent prescription, family and friends giving away and/or selling their prescriptions, and theft.
The paper goes on to estimate a model of addiction using Markov chains—basically, what’s the likelihood that a person who experiments with opioids for fun or for pain management start to misuse their prescriptions over time, based on their personal characteristics, the price, and what they know about addiction risk. They fit the model to the data, to see which of the explanations seems to fit the pattern of addictions, responses to changes in policy and price, and so on.
The calibrated model is then used to highlight the forces underlying the recent opioid epidemic. Through the eyes of the model, there were two key forces. The first force is the decline in prices for both prescription and black market opioids. This had a big effect. The second force is the increase in the dosages per prescription meted out by doctors. This also had a significant impact. The fact that doctors kept pain suffers on prescription opioids for a longer period of time had little effect. Last, an analysis is conducted on medical interventions that reduce either the probability of becoming addicted or the odds of an addict dying from an overdose. While such interventions are valued by consumers, they increase the number of opioid users. Reducing the odds of addiction can result in even more deaths due to the rise in users.
It’s an engaging paper, worth reading, and a model for how to explain a complicated policy problem briefly and intelligently in prose and figures and math.