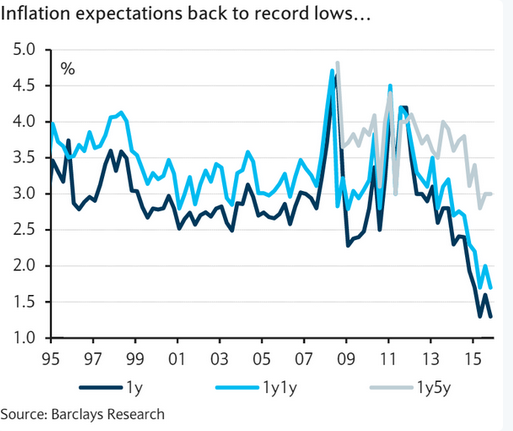
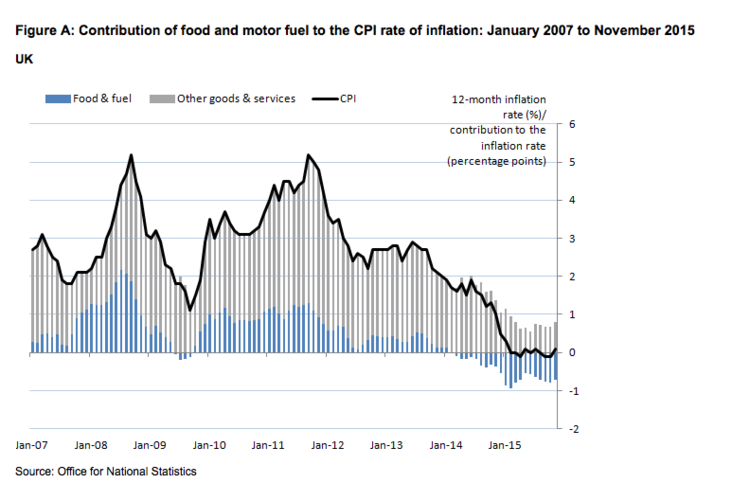
January 14th, 2016 Figure 1 source: @SoberLook @SoberLook yesterday shared this chart of collapsing UK inflation expectations from Barclays Research UK, heightening fears of a deflationary spiral. As noted in an earlier blog, the year 2015 began with the Chancellor, George Osborne ‘welcoming’ the news that inflation had fallen in December to 0.5% – more than 1% below the official target. The FT declared that “this is almost certainly “good deflation”. Jittery stock markets are now skeptical of the Chancellor’s earlier complacency as UK prices continued to fall at the end of 2015, as the ONS chart below shows. This is worrying for firms, SMEs and households, as both debt and debt servicing costs rise in real terms as general falls in the prices of goods and services occur, and as average real wages remain almost 8% below pre-crisis level. (This is calculated from ONS data comparing Q1 2008 with Q3 2015). The fall in prices (actual and in trajectory) must be considered in the context of Britain’s excessive private household debt, as well as recent movements in rates by US monetary authorities.
Topics:
Ann Pettifor considers the following as important: Uncategorized
This could be interesting, too:
tom writes The Ukraine war and Europe’s deepening march of folly
Stavros Mavroudeas writes CfP of Marxist Macroeconomic Modelling workgroup – 18th WAPE Forum, Istanbul August 6-8, 2025
Lars Pålsson Syll writes The pretence-of-knowledge syndrome
Dean Baker writes Crypto and Donald Trump’s strategic baseball card reserve
January 14th, 2016
@SoberLook yesterday shared this chart of collapsing UK inflation expectations from Barclays Research UK, heightening fears of a deflationary spiral. As noted in an earlier blog, the year 2015 began with the Chancellor, George Osborne ‘welcoming’ the news that inflation had fallen in December to 0.5% – more than 1% below the official target. The FT declared that “this is almost certainly “good deflation”. Jittery stock markets are now skeptical of the Chancellor’s earlier complacency as UK prices continued to fall at the end of 2015, as the ONS chart below shows. This is worrying for firms, SMEs and households, as both debt and debt servicing costs rise in real terms as general falls in the prices of goods and services occur, and as average real wages remain almost 8% below pre-crisis level. (This is calculated from ONS data comparing Q1 2008 with Q3 2015).
The fall in prices (actual and in trajectory) must be considered in the context of Britain’s excessive private household debt, as well as recent movements in rates by US monetary authorities. Even while the Bank of England may hold rates at present levels, the modest interest rate rise announced by US Fed governor Janet Yellen in December is likely to have far-reaching consequences for private ‘free’ market rates – the rates paid by firms and households in the real economy – and for global financial stability. Central bankers have abandoned control or influence over these rates worldwide. Their main concern is to keep borrowing costs low for private bankers. By contrast high real ‘market rates’ are fixed (think of the Libor scandal) by private creditors and bankers and applied to all forms of commercial and household lending.
The guardians of UK finances – namely the Chancellor, Treasury and Bank of England – have so far done very little to address the threat posed to the UK economy by a) disinflation/noflation/deflation; b) real rising private debt levels and c) real rises in rates of interest – in a context of insecure employment and low real wages.
The Office for Budgetary Responsibility (OBR) forecast now expects (see p.68) gross UK household debt to reach “163 per cent of household disposable income by the end of the forecast period” [2021] – revised slightly down from an expected 172 per cent in their July 2015 forecast, but still almost as high as at the time of the financial crisis in 2008.
The cause is the liberal finance economic model applied before the crisis and that has only been tinkered with since. The dominant model remains the same as before 2008, with the private finance sector immensely strengthened by a novel form of protectionism: government guarantees against losses, low rates of interest fixed by central bank committees and ‘easy’ money in the form of Quantitative Easing.
As in the run-up to the crisis, so too in the event the economic model remains unchanged, rising real levels of private debt will continue to exceed real wages, incomes and prices – and will lead inexorably to Britain’s next financial crisis.
This blog has been verified by Rise: R64c702d781d17c141c43f7cd39e8585f


