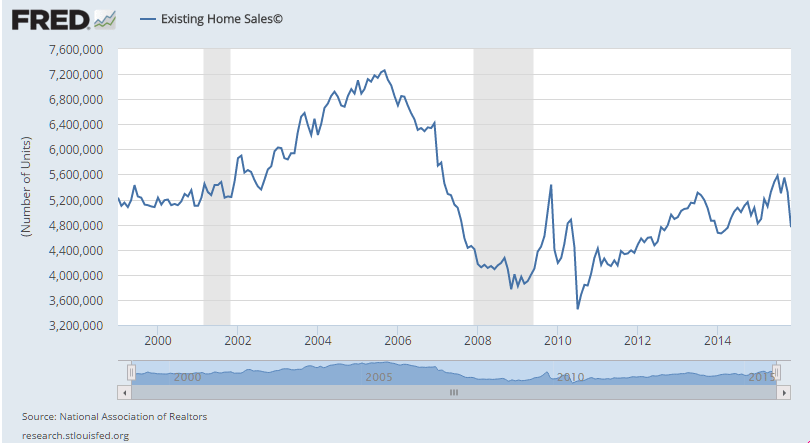
This means ‘the swamp has been drained’ and falling production has eliminated the trapped oil in Cushing that caused WTI to be at a discount to Brent. In fact, Brent should trade at a discount to WTI when the shortage is fully eliminated, reflecting transportation costs to the US. This, however, does not mean there’s any kind of national shortage or that prices will go up as unlimited imports are continuously available at then current prices, and last I saw the Saudis are still discounting their crudein an attempt to sell their full capacity output as previously discussed:This chart puts it in historical perspective. Housing was forecast to be the ‘driver’ of growth. Unfortunately all it’s done is turn south like most all the other stats, and nothing has stepped up to replace the lost oil capex which had stepped up to offset the tax hikes and sequesters.
Topics:
WARREN MOSLER considers the following as important: GDP, housing, Oil
This could be interesting, too:
Nick Falvo writes Subsidized housing for francophone seniors in minority situations
NewDealdemocrat writes Declining Housing Construction
Angry Bear writes GDP Grows 2.3 Percent
Nick Falvo writes Homelessness among older persons
This means ‘the swamp has been drained’ and falling production has eliminated the trapped oil in Cushing that caused WTI to be at a discount to Brent. In fact, Brent should trade at a discount to WTI when the shortage is fully eliminated, reflecting transportation costs to the US.
This, however, does not mean there’s any kind of national shortage or that prices will go up as unlimited imports are continuously available at then current prices, and last I saw the Saudis are still discounting their crudein an attempt to sell their full capacity output as previously discussed: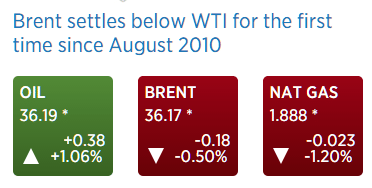
This chart puts it in historical perspective. Housing was forecast to be the ‘driver’ of growth. Unfortunately all it’s done is turn south like most all the other stats, and nothing has stepped up to replace the lost oil capex which had stepped up to offset the tax hikes and sequesters. And remember the population grows at about 3 million per year, so it’s even worse on a per capita basis: