Soon after the 2015 federal election, Prime Minister-designate Justin Trudeau affirmed that Canada was back as a “compassionate and constructive voice in the world” after a decade of Conservative governments. One of the most important means by which any industrialized country interacts with the developing world is via the amount, composition and effectiveness of its foreign aid, which can help boost human and economic development, mitigate humanitarian crises and reduce environmental degradation. There are many types of “foreign aid”, but the most widely-accepted and quantified is Official Development Assistance (ODA). In this post I focus on the amount of Canada’s ODA from a historical, OECD and global (United Nations) perspective. As outlined below, based partly on former Canadian PM
Topics:
Edgardo Sepulveda considers the following as important: Canada, development, federal budget, fiscal federalism, fiscal policy, G-8, OECD, Poverty, taxation, World Bank
This could be interesting, too:
Nick Falvo writes Homelessness among older persons
Angry Bear writes A Fiscal Policy in a Global Context?
Nick Falvo writes Homelessness planning during COVID
Nick Falvo writes Demand-side housing assistance
Soon after the 2015 federal election, Prime Minister-designate Justin Trudeau affirmed that Canada was back as a “compassionate and constructive voice in the world” after a decade of Conservative governments. One of the most important means by which any industrialized country interacts with the developing world is via the amount, composition and effectiveness of its foreign aid, which can help boost human and economic development, mitigate humanitarian crises and reduce environmental degradation. There are many types of “foreign aid”, but the most widely-accepted and quantified is Official Development Assistance (ODA).
In this post I focus on the amount of Canada’s ODA from a historical, OECD and global (United Nations) perspective. As outlined below, based partly on former Canadian PM Lester Pearson’s global leadership, in 1970 the UN established an ODA target of 0.7% of GDP. As a number of other analysts have pointed out, Canada was an ODA leader in the 1970’s; however, since that time, Canada’s performance has slipped, and is now well below that of most comparator countries. I find that the majority of this decline is due to a decrease in ODA budget allocation, primarily a political (rather than fiscal) decision. Canada’s ODA will continue to decline and is forecast to hit historical lows by 2021. PM Justin Trudeau appears to want to enable most Canadians’ wish to see themselves as compassionate global citizens; the reality, however, is that the current Liberal Government has not reflected this desire in its ODA budgetary decisions. Canada can and should do better.
Background
As developed by the OECD, ODA is government-provided concessional or grant-based assistance to developing countries with the main objective of promoting economic development and welfare. ODA does not include assistance to other industrialized countries, or any form of military, private or corporate assistance, nor does it include commercial transactions. ODA is voluntary; some countries provide relatively more while others relatively less. ODA is a relatively modern concept which was conceived during the post-WWII period of the newly-formed United Nations, the World Bank and other international institutions.
During the 1960s, after many struggles for independence from colonialism had occurred, there was a political motivation to commit and increase ODA to newly-independent former colonies. In 1968 the World Bank appointed former Canadian PM Lester Pearson to lead a “Commission on International Development” to guide future development efforts, with 7 other members, most notably future Economics Nobel Laureate Arthur Lewis representing Jamaica.
The Commission’s 1969 report, “The Pearson Report,” included a recommendation that the “wealthy countries” should increase their ODA to 0.7% of GNP by 1975 and no later than 1980. The political momentum of this initiative culminated the next year when the Second Committee of the UN General Assembly (GA) adopted Resolution 2626 in October 1970 stating that “Each economically advanced country will progressively increase its [ODA] … and will exert its best efforts to reach a minimum net amount of 0.7 per cent of its [GNP] … by the middle of the Decade.” Such GA Resolutions are non-binding.
Actual Performance
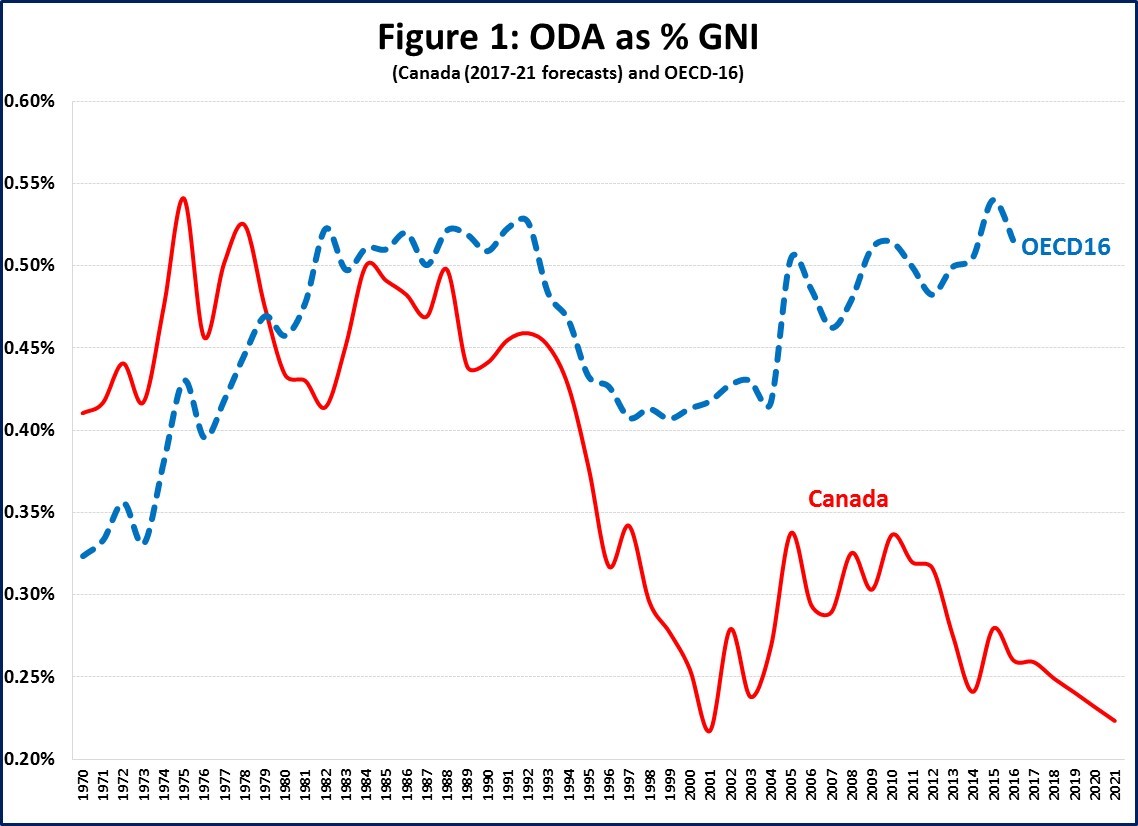
Figure 1 presents ODA as a percent of gross national income (GNI – the modern equivalent used by the OECD, instead of GNP or GDP) for Canada and 16 other OECD countries for which data exists back to 1970 (OECD-16: Australia, Austria, Belgium, Denmark, Finland, France, Germany, Italy, Japan, Netherlands, New Zealand, Norway, Sweden, Switzerland, United Kingdom and USA). All data for this and other international figures are from the OECD. Figure 1 also includes 2017-21 forecasts for Canada, which I calculated based on the recent 2017 Federal Budget.
Figure 1 shows that in 1970 Canada was one of the world leaders in ODA/GNI, with 0.41%. These were heady days for Canada’s ODA. Pearson’s successor, PM Pierre Trudeau, had established the Canadian International Development Agency (CIDA) in 1968 and would establish the International Development Research Centre (IDRC) in 1970. There was domestic support for increased ODA, as reflected in the public consultations prior the Government’s “Foreign Policy for Canadians” issued in June 1970, which stated that “the Government will endeavor to increase each year the percentage of [GNI] allocated to [ODA]”. In effect, Canada’s ODA/GNI reached 0.54% in 1975. That was Canada’s high-point, however, after which it remained relatively stable around 0.4 to 0.5%, until a precipitous decline that started in the early-1990s and reached a low-point of 0.22% in 2001. There have also been institutional changes, with the previous Conservative Government disbanding CIDA in 2013 and moving ODA functions to the Department of Foreign Affairs. ODA dipped to an average of 0.26% of GNI over the 2014-2016 period, and based on the 2017 Federal Budget will continue to decline, hitting the historical 0.22% low-point in 2021.
Fiscal Capacity and ODA Budgetary Allocation
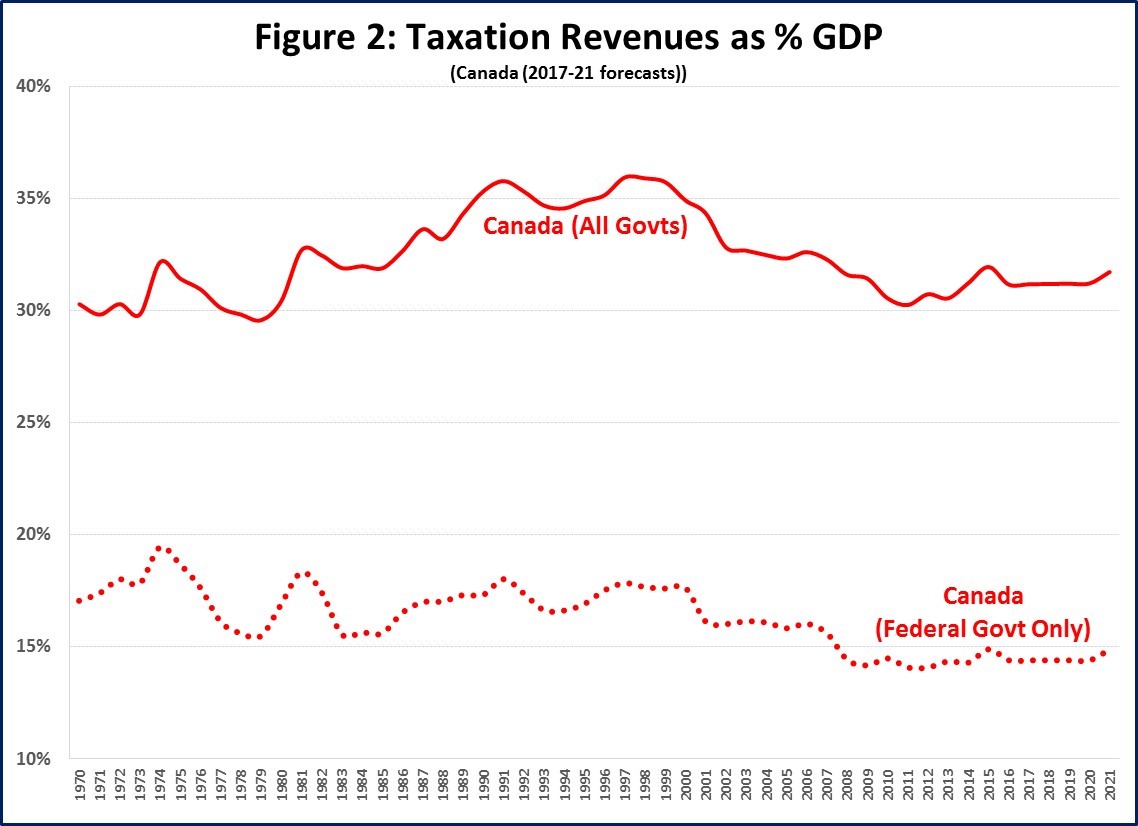
So what are the fiscal mechanics that can explain Canada’s shift from being an ODA leader to an ODA straggler? Focussing only on fiscal matters, and abstracting from debt-related issues, a country’s expenditures on a specific program are a combination of its fiscal capacity (proxied here by total taxation revenues) and budgetary allocation. With respect to the former, Figure 2 shows total (“all Government”) taxation revenues as a percentage of GDP for Canada as a whole (All Govts), and because ODA is a federal responsibility in Canada, for the Federal Government only (i.e. including only Federal Taxation Revenues). For both series, I also include 2017-21 forecasts, based on the 2017 Federal Budget.
Figure 2 shows that Canada (All Govts) taxation revenues increased from about 30% in the 1970s to about 35% in the 1990s, after which they declined and stabilized around 31% in the 2010s. The levels over the last decade are roughly comparable to those in the 1970’s and 1980’s, which suggests that there is no strong long-term relationship between the reduction in ODA/GNI and Canada (All Govts) fiscal capacity. However, Figure 2 does show that Federal Taxation Revenues relative to GDP have declined in the last few decades as result of a long-term shift in “fiscal federalism,” whereby the Federal portion of total taxation revenues has decreased, resulting in a decrease in Federal fiscal capacity from around 17%-18% of GDP in the 1970s and 1980s to about 14% since 2008.
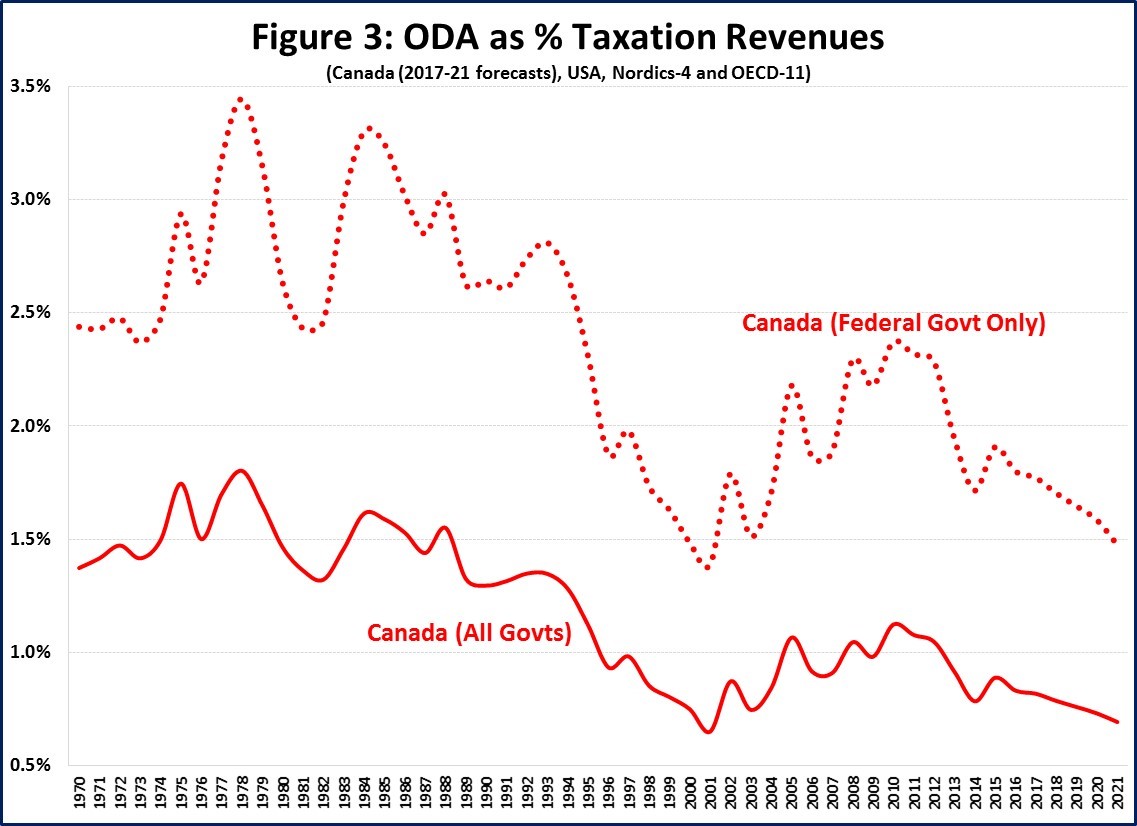
Figure 3 shows ODA as a % of total taxation revenues and highlights that both series have a long-term downward trend. For example, over the 1975-1988 period, ODA accounted for 2.95% of Federal taxation revenues, but is forecast to average only 1.70% over the 2014-2021 period. This suggests that Canada’s budgetary allocation to ODA (primarily a political decision) has a much larger role in the decrease of ODA than any shift in fiscal capacity.
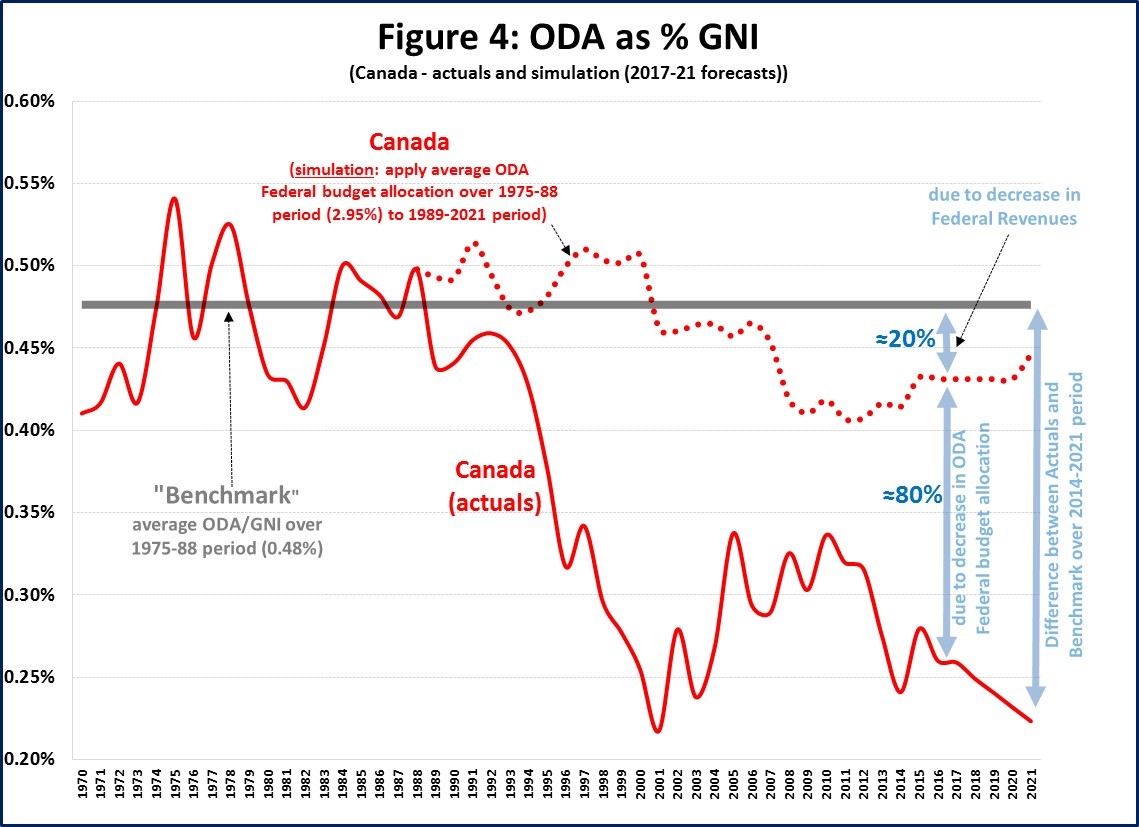
Figure 4 provides a graphical presentation of the budget allocation / fiscal capacity issue. I apply the average 1975-88 ODA Federal budget allocation (2.95%) to the subsequent period from 1989 to 2021. I use the average ODA/GNI over the same 1975-88 period as a benchmark against which to assess subsequent changes. As a reasonableness check, this “benchmark” is the same as the average OECD-16 ODA/GNI over the 1989-2016 period.
In effect, Figure 4 shows what ODA would have been over the 1989-2021 period if ODA had the same political weight as in the earlier period. In this manner, I calculate that over the 2014-21 period, the change in budgetary allocation accounts for about 80% of the difference between the “Actuals” and the Benchmark. The remaining 20% difference is attributable to reduced Federal fiscal capacity. From this perspective, the current reduction in ODA in Canada has largely been a political decision, rather than a fiscal necessity.
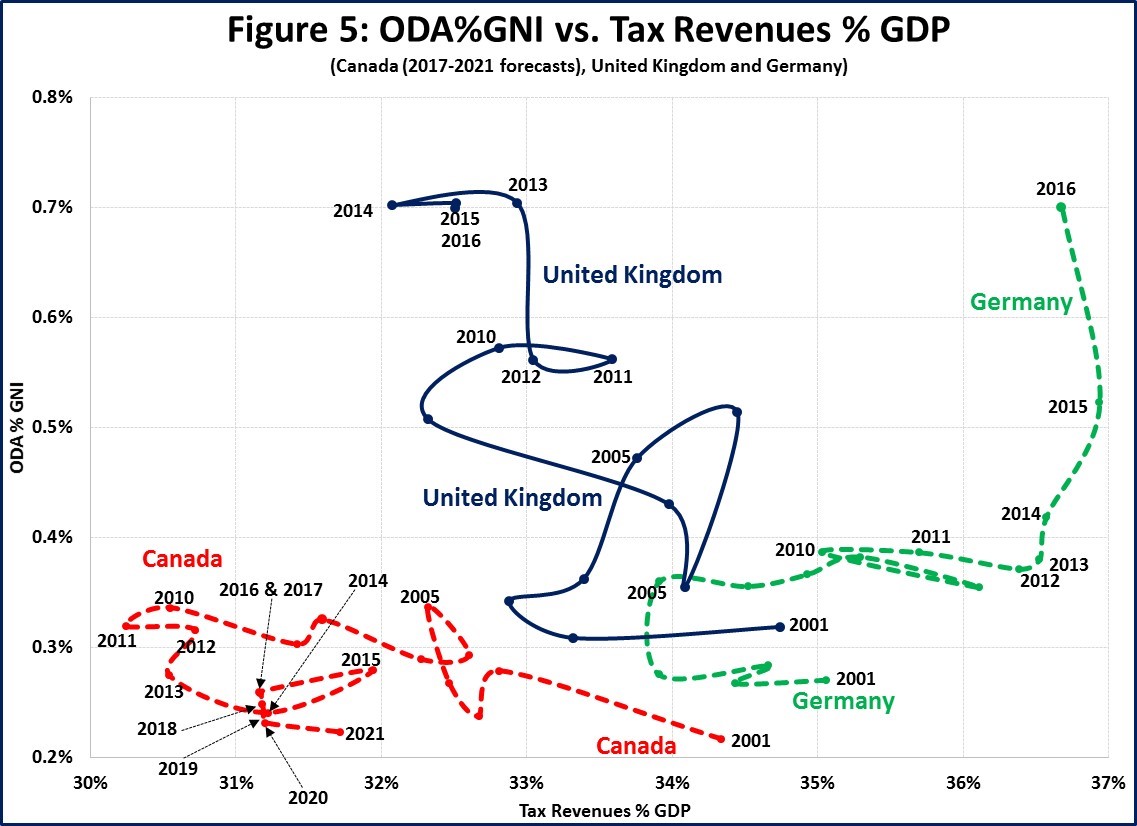
To highlight this aspect, Figure 5 shows how ODA has evolved since 2001 in Canada, UK and Germany. These two G7 countries have traditionally not been members of either the “high ODA club” (e.g. Denmark, Netherlands, Norway and Sweden which reached 0.7% by 1980 and have averaged between 0.9%-1.0% since then) or the “low ODA club” (e.g. Italy, Japan and USA which have averaged between 0.20%-0.25% for the last forty years). Rather, these countries were “middle of the pack” countries, a club that Canada had joined by the early 2000s. Figure 5 shows that these three G7 countries were similarly-situated in 2001, with roughly similar ODA/GNI and tax revenues to GDP figures.
Since that year, however, both Germany and UK have increased their ODA to reach 0.7%, while Canada has languished. Figure 5 shows that Germany generally has increased taxation revenues as it has increased ODA. This contrasts with the UK where ODA has increased in the context of decreasing taxation revenues as a percent of GDP. What increased in both instances is the ODA budget allocation: from 0.9% in the 2000s to 1.5% over the last 3 years for Germany and from 1.2% to 2.1% in the UK. That is, independent of their respective fiscal capacity, both countries made a political decision to substantially increase their ODA budget allocation.
Concluding Thoughts
This post has focussed on the long-term shift in the amount of Canada’s ODA from a historical, OECD and UN perspective, to show how Canada evolved from an ODA leader in 1970s to its current laggard status. I calculated that the majority of this decline is due to a decrease in ODA budget allocation, rather than a matter of fiscal capacity. Canada can indeed remain as a “compassionate and constructive voice in the world” by increasing its ODA, independent of any change in fiscal policy. This has always been a political budgetary question, not an economic issue. In this regard the Government’s 1970 Foreign Policy document issued by PM Pierre Trudeau’s Government in 1970 was very clear-eyed:
“The review has indicated that it is within the ability of the Canadian economy to make available resources for any level of [ODA] that is within the range of practical consideration. Most of these resources will, of course, have to be directed away from other purposes to which the Canadian people would otherwise apply them. But the review indicates that this sacrifice can be made without lowering Canadian standards of living […]. The main constraints arise because the argest portion of the transfer of resources takes the form of [ODA], and must be directed through the public sector accounts. The question of what can be “afforded” is thus a budgetary one, and not a question of the basic availability of resources in Canada”.
Enjoy and share:

