The UK environmental accounts.“Energy consumption from renewable and waste sources has been increasing since 1990; reaching a record high of 14.4 million tonnes of oil equivalent in 2014. These sources contributed 7.1% of total energy consumption.Emissions of greenhouse gases have decreased since 1990; peaking in 1991 at 845.2 million tonnes of carbon dioxide equivalent and falling to 608.6 million tonnes of carbon dioxide equivalent in 2014. This is the lowest level since 1990. The amount of material resources consumed (per person) has decreased by 30.4% between 2000 and 2014, falling from 12.5 tonnes per person to 8.7 tonnes per person.The trend of road transport fuel switching from petrol to diesel continued. Between 2013 and 2014, diesel use increased by 3.3%, whereas petrol use decreased by 2.0%. Since 1997, UK government spend on environmental protection expenditure (EPE) has increased from £4.1 billion to £15.4 billion in 2014, and currently accounts for 1.9% of total government spending. Environmental accounts show how the environment contributes to the economy (for example, through the extraction of raw materials), the impact that the economy has on the environment (for example, energy consumption and air emissions) and how society responds to environmental issues (for example, through taxation and expenditure on environmental protection).
Topics:
Merijn T. Knibbe considers the following as important: Uncategorized
This could be interesting, too:
tom writes The Ukraine war and Europe’s deepening march of folly
Stavros Mavroudeas writes CfP of Marxist Macroeconomic Modelling workgroup – 18th WAPE Forum, Istanbul August 6-8, 2025
Lars Pålsson Syll writes The pretence-of-knowledge syndrome
Dean Baker writes Crypto and Donald Trump’s strategic baseball card reserve
- The UK environmental accounts.
“Energy consumption from renewable and waste sources has been increasing since 1990; reaching a record high of 14.4 million tonnes of oil equivalent in 2014. These sources contributed 7.1% of total energy consumption.Emissions of greenhouse gases have decreased since 1990; peaking in 1991 at 845.2 million tonnes of carbon dioxide equivalent and falling to 608.6 million tonnes of carbon dioxide equivalent in 2014. This is the lowest level since 1990. The amount of material resources consumed (per person) has decreased by 30.4% between 2000 and 2014, falling from 12.5 tonnes per person to 8.7 tonnes per person.The trend of road transport fuel switching from petrol to diesel continued. Between 2013 and 2014, diesel use increased by 3.3%, whereas petrol use decreased by 2.0%. Since 1997, UK government spend on environmental protection expenditure (EPE) has increased from £4.1 billion to £15.4 billion in 2014, and currently accounts for 1.9% of total government spending.
Environmental accounts show how the environment contributes to the economy (for example, through the extraction of raw materials), the impact that the economy has on the environment (for example, energy consumption and air emissions) and how society responds to environmental issues (for example, through taxation and expenditure on environmental protection). Environmental accounts are “satellite accounts” to the main National Accounts … This means that they are comparable with economic indicators such as gross domestic product (GDP).”.
2. Antonio Fatas and Lawrence Summers about shooting yourself in the foot
The global financial crisis has permanently lowered the path of GDP in all advanced economies. At the same time, and in response to rising government debt levels, many of these countries have been engaging in fiscal consolidations that have had a negative impact on growth rates. We empirically explore the connections between these two facts by extending to longer horizons the methodology of Blanchard and Leigh (2013) regarding fiscal policy multipliers. Our results provide support for the presence of strong hysteresis effects of fiscal policy. The large size of the effects points in the direction of self-defeating fiscal consolidations as suggested by DeLong and Summers (2012). Attempts to reduce debt via fiscal consolidations have very likely resulted in a higher debt to GDP ratio through their long-term negative impact on output
>
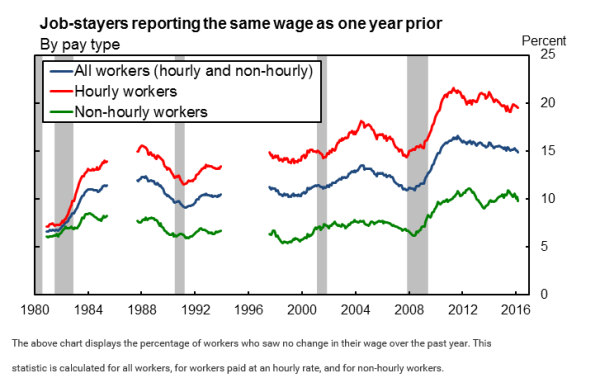
3. Via the San Fransico Fed: the wage rigidity meter. No, flexible wages are not the solution to downturns. To the contrary. Which does not mean that wage rigidity is not important. It increases during downturns.
4. (Via Marginal Revolution). GDP is an aggregate. Taking account of the micro data as well as the aggregates is crucial to understand what is happening. About this a very interesting and important comparison of micro and macro price levels and inflation: there is a lot of stability when it comes to differences between households. But this is exactly why ‘representative consumer’ models do not work:
This paper documents massive heterogeneity in inflation rates at the household level, an order of magnitude larger than that found in previous work, owing to differences across households in prices paid within the same categories of goods. Such heterogeneity poses a range of challenges for monetary economics. Optimal policy in most monetary models is calculated to maximize the welfare of a representative household that faces the aggregate inflation rate; because extreme inflation rates cause larger welfare losses than small inflation rates, optimal policy could be different if one accounted for heterogeneity in inflation and for the policy’s effect on heterogeneity. In addition, even in models that relax the representative-agent assumption by allowing uninsured shocks to generate heterogeneity in assets and consumption, all households typically face the same inflation rate and hence the same real interest rate … Optimal policy might differ if models allowed households to face identical nominal interest rates but, because inflation rates vary, different real rates. Furthermore, the heterogeneity we observe suggests that movements of the aggregate price level may not be an important determinant of individual agents’ inflation rates, potentially explaining why households and small firms fail to be well-informed about aggregate inflation and monetary policy (Binder, 2015; Kumar et al.,forthcoming).

