From David Ruccio A new report from McKinsey & Company, “Poorer than Their Parents? Flat or Falling Incomes in Advanced Countries” (pdf), confirms many people’s worst fears. As it turns out, the trend in stagnating or declining incomes for most workers (including the middle-class) is not confined to the United States, but is a global phenomenon. Brexit and Trump are just the tip of the iceberg. Because of flat or falling incomes, many workers across the rich countries are angry and want change. According to the authors of the report, as much as 70 percent of the households in 25 advanced economies saw their incomes drop in the past decade. That compares to just 2 percent of households that saw declining incomes in the previous 12 years.* In the United States, fully 81 percent of households suffered a decline in market income between 2005 and 2013. But, as it turns out, after taxes and transfers, falling market incomes were turned into flat disposable incomes. (The situation elsewhere, such as in France, the Netherlands, the United Kingdom, and Italy, was even worse, in terms of both market and disposable incomes.) Here’s what the U.S.
Topics:
David F. Ruccio considers the following as important: Uncategorized
This could be interesting, too:
tom writes The Ukraine war and Europe’s deepening march of folly
Stavros Mavroudeas writes CfP of Marxist Macroeconomic Modelling workgroup – 18th WAPE Forum, Istanbul August 6-8, 2025
Lars Pålsson Syll writes The pretence-of-knowledge syndrome
Dean Baker writes Crypto and Donald Trump’s strategic baseball card reserve
from David Ruccio
A new report from McKinsey & Company, “Poorer than Their Parents? Flat or Falling Incomes in Advanced Countries” (pdf), confirms many people’s worst fears. As it turns out, the trend in stagnating or declining incomes for most workers (including the middle-class) is not confined to the United States, but is a global phenomenon.
Brexit and Trump are just the tip of the iceberg. Because of flat or falling incomes, many workers across the rich countries are angry and want change.
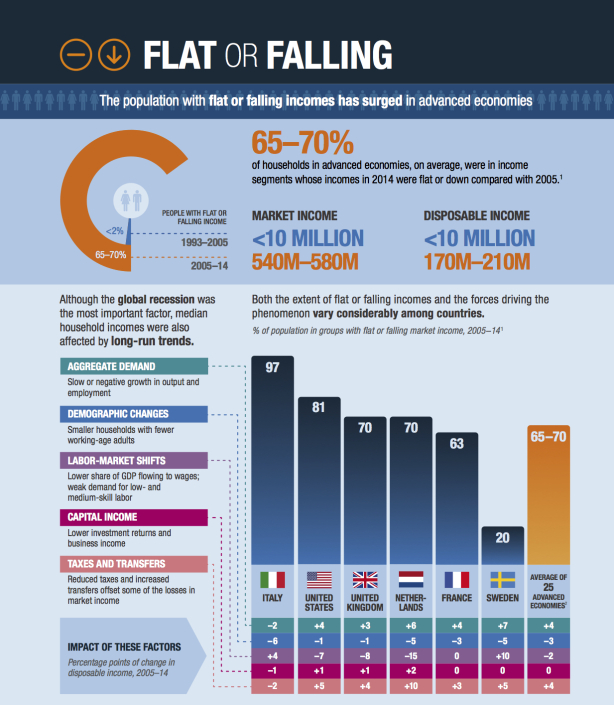
According to the authors of the report, as much as 70 percent of the households in 25 advanced economies saw their incomes drop in the past decade. That compares to just 2 percent of households that saw declining incomes in the previous 12 years.*
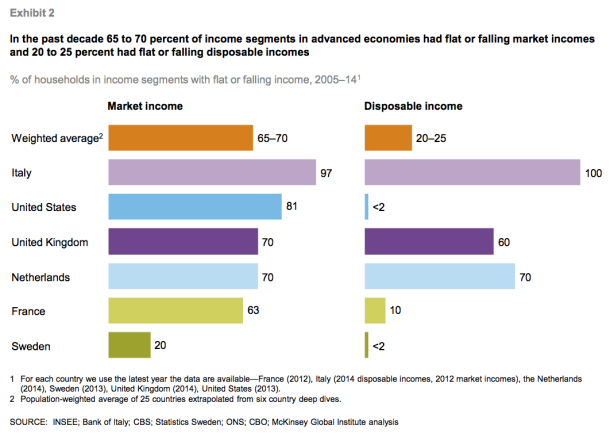
In the United States, fully 81 percent of households suffered a decline in market income between 2005 and 2013. But, as it turns out, after taxes and transfers, falling market incomes were turned into flat disposable incomes. (The situation elsewhere, such as in France, the Netherlands, the United Kingdom, and Italy, was even worse, in terms of both market and disposable incomes.)
Here’s what the U.S. numbers mean: employers were able to take advantage of declining labor incomes (since only upper-income households experienced strong wage growth, which is really just a distribution of the surplus to most of them), thus increasing corporate profits; while workers, through taxes on their wages (and thus not a distribution of the surplus), were forced to pay to finance programs that helped reverse some of the effect of declining market incomes.
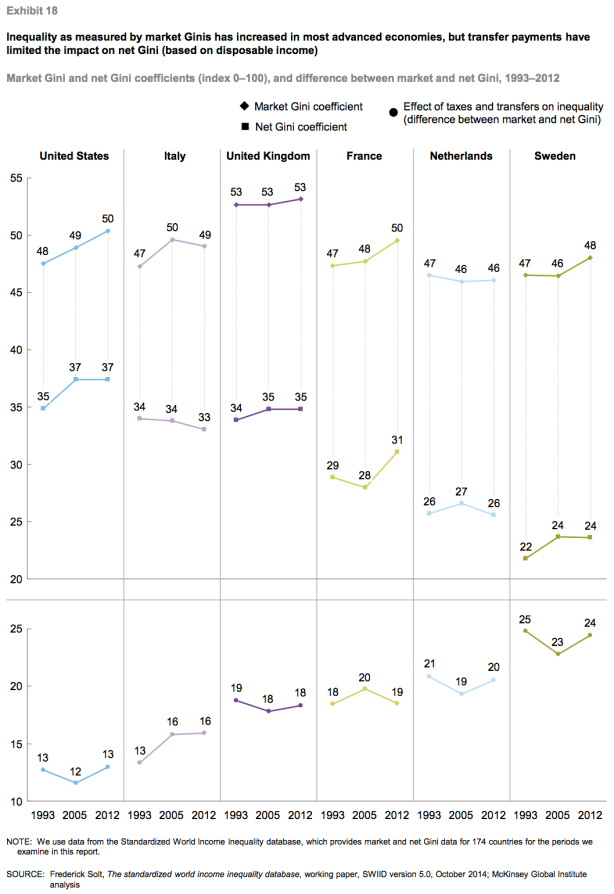
Another major consequence of flat or falling incomes is a dramatic increase in inequality over the course of the past two decades. Since I’m quite critical of comparing inequality indicators (e.g., Gini coefficients) across countries (as I explained here), what is most relevant is the change in inequality indicators for individual countries and, especially, the difference between market-income and disposable-income indicators. Thus, for example, when the authors of the report calculate “net Gini” (market Ginis minus the effect of taxes and transfers, the middle line for each country in the chart above), the United States ends up reversing market inequality the least—scoring 35 in 1993 and 37 in 2005 and 2012.**
United States ends up reversing market inequality the least—scoring 35 in 1993 and 37 in 2005 and 2012.**
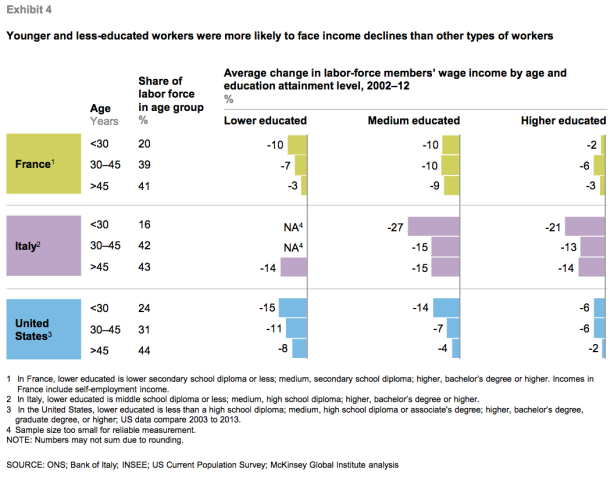
The final major economic consequence, in the United States and elsewhere is that today’s younger generation—regardless of level of education—is increasingly at risk of ending up poorer than their parents. As readers can see in the chart above, wage incomes declined for all segments of the labor force in the 2002–12 period but, in all three countries, wage income declines were most severe for younger workers (under the age of 30). The average decrease in the wage income of these young workers ranged from 2 percent (for higher educated workers in France) to 27 percent (for medium educated workers in Italy). In the United states, lower educated young workers faced a decline of 15 percent, similar to that of medium educated workers; while even higher educated young workers saw a decline in their incomes.
And then, of course, there are the political consequences of flat or declining incomes. The authors of the report note that
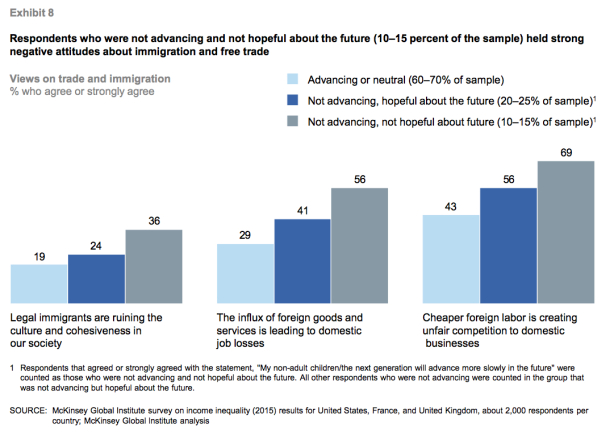
The people who felt they were not advancing and believed this was a persistent problem expressed sharply negative views of foreign trade and immigration. They were nearly twice as likely to believe that “Legal immigrants are ruining the culture and cohesiveness of our society” as those who were advancing or neutral, and one-and-a-half times as likely as those who were not advancing but hopeful about the future. Nearly 70 percent of them also agreed with the statement “Cheaper foreign labor is creating unfair competition to our domestic businesses,” compared with 43 percent of those who were advancing or neutral. Fifty-six percent of them also believed that “The influx of foreign goods and services is leading to domestic job losses,” compared with 29 percent of the advancing or neutral respondents and 41 percent of those who were not advancing but hopeful about the future.
By implication, failure to correct flat or falling incomes could lead to a rise in the number of people who see flat or falling incomes as a persistent problem and lose faith in tenets of the global economic architecture.
That’s the source of the challenge to the self-professed expertise of mainstream economists (who tend to celebrate a market-based global economy), as well as movements as diverse as Brexit, the Trump campaign, and the insurgency within the Democratic Party represented by Bernie Sanders.
But the authors of the report are not done. The natural final question is, what are the prospects for the future? Their conclusion is, to say the least, sobering. If present trends continue—including the decline in labor unions, the continuation of job-displacing digital technologies, the rise in temporary and part-time work, and overall slow growth—it is likely
an even larger proportion of income groups in advanced economies—from 70 to 80 percent—could experience flat or falling real market incomes in the next decade to 2025 than did during the 2005–12 period.
As I see it, the existing set of economic institutions can neither accommodate nor preclude the possibility of an even larger portion of flat or falling incomes for the foreseeable future. The current economic system has failed, even on its own terms.
The situation is so dire that the authors of the report (who, remember, did this research for McKinsey, the most prestigious management consultancy in the world) note that “the idea of a guaranteed basic income has attracted renewed interest as policy makers seek to grapple with flat or falling incomes in the middle class, high youth unemployment, and the prospect of further job losses to digitization.”
A universal basic income is certainly a start. It’s a recognition of how dire the current situation is and how ominous the future prospects are for the majority of the population—workers, the middle-class, call them what you will—within the advanced countries.
But it’s only a start. The widespread nature of flat or falling incomes in the United States and across the rich countries, and then the dire forecast looking forward, mean it’s time to imagine and create a radically different way of organizing economic and social life.
*In general, the analysis in the report appears to be carefully done. I do, however, have one criticism. The major comparison is between two periods: 1993-2005 (when most incomes were rising) and 2005-2014 (when they were falling). That’s fine. All of the data of which I am aware (such as real wages and average 90-percent incomes) confirm much the same trends. The problem is, it was in the mid-1990s that workers’ incomes were at their lowest. If we extended the analysis back to the mid-1970s, then we’d discover that, across the entire 1973-2014 period, workers’ incomes have been generally flat (with both short-term increases and decreases within that long-term trend).
**On a scale of 0 to 100, where a score of 100 indicates complete inequality (one person earns all of the income) and a score of 0 represents completely even distribution of income across the population (each citizen earns the same amount). Numbers in the high 40s for market income and high 30s in the net Gini coefficient (after taxes and transfers) indicate an obscenely unequal distribution of income in the United States.