From David Ruccio We’re all familiar with the usual indictment of the U.S. healthcare system: we pay much more and we get much less. For example, according to the Commonwealth Fund: Data from the OECD show that the U.S. spent 17.1 percent of its gross domestic product (GDP) on health care in 2013. This was almost 50 percent more than the next-highest spender (France, 11.6% of GDP) and almost double what was spent in the U.K. (8.8%). Since 2009, health care spending growth has slowed in the U.S. and most other countries. The real growth rate per capita in the U.S. declined from 2.47 percent between 2003 and 2009 to 1.50 percent between 2009 and 2013. In Denmark and the United Kingdom, the growth rate actually became negative. The timing and cross-national nature of the slowdown suggest a connection to the 2007–2009 global financial crisis and its aftereffects, though additional factors also may be at play. . . On several measures of population health, Americans had worse outcomes than their international peers. The U.S. had the lowest life expectancy at birth of the countries studied, at 78.8 years in 2013, compared with the OECD median of 81.2 years. Additionally, the U.S. had the highest infant mortality rate among the countries studied, at 6.1 deaths per 1,000 live births in 2011; the rate in the OECD median country was 3.5 deaths.
Topics:
David F. Ruccio considers the following as important: Uncategorized
This could be interesting, too:
tom writes The Ukraine war and Europe’s deepening march of folly
Stavros Mavroudeas writes CfP of Marxist Macroeconomic Modelling workgroup – 18th WAPE Forum, Istanbul August 6-8, 2025
Lars Pålsson Syll writes The pretence-of-knowledge syndrome
Dean Baker writes Crypto and Donald Trump’s strategic baseball card reserve
from David Ruccio
We’re all familiar with the usual indictment of the U.S. healthcare system: we pay much more and we get much less.
For example, according to the Commonwealth Fund:
Data from the OECD show that the U.S. spent 17.1 percent of its gross domestic product (GDP) on health care in 2013. This was almost 50 percent more than the next-highest spender (France, 11.6% of GDP) and almost double what was spent in the U.K. (8.8%).
Since 2009, health care spending growth has slowed in the U.S. and most other countries. The real growth rate per capita in the U.S. declined from 2.47 percent between 2003 and 2009 to 1.50 percent between 2009 and 2013. In Denmark and the United Kingdom, the growth rate actually became negative. The timing and cross-national nature of the slowdown suggest a connection to the 2007–2009 global financial crisis and its aftereffects, though additional factors also may be at play. . .
On several measures of population health, Americans had worse outcomes than their international peers. The U.S. had the lowest life expectancy at birth of the countries studied, at 78.8 years in 2013, compared with the OECD median of 81.2 years. Additionally, the U.S. had the highest infant mortality rate among the countries studied, at 6.1 deaths per 1,000 live births in 2011; the rate in the OECD median country was 3.5 deaths.
That alone is an argument in favor of Medicare for all.
On top of that, we know that healthcare outcomes within the United States are profoundly unequal (e.g., since the life expectancy gap between those at the top and bottom of the distribution of income is growing).
Now, we’re learning, thanks to a new study on healthcare use and expenditures that appears in the July 2016 issue of the journal Health Affairs [ht: sm], that healthcare spending itself is highly unequal.
According to the authors of the study (unfortunately behind a paywall), even as the increase in overall health costs has slowed (starting in 2004), healthcare spending has become increasingly skewed toward wealthier Americans.
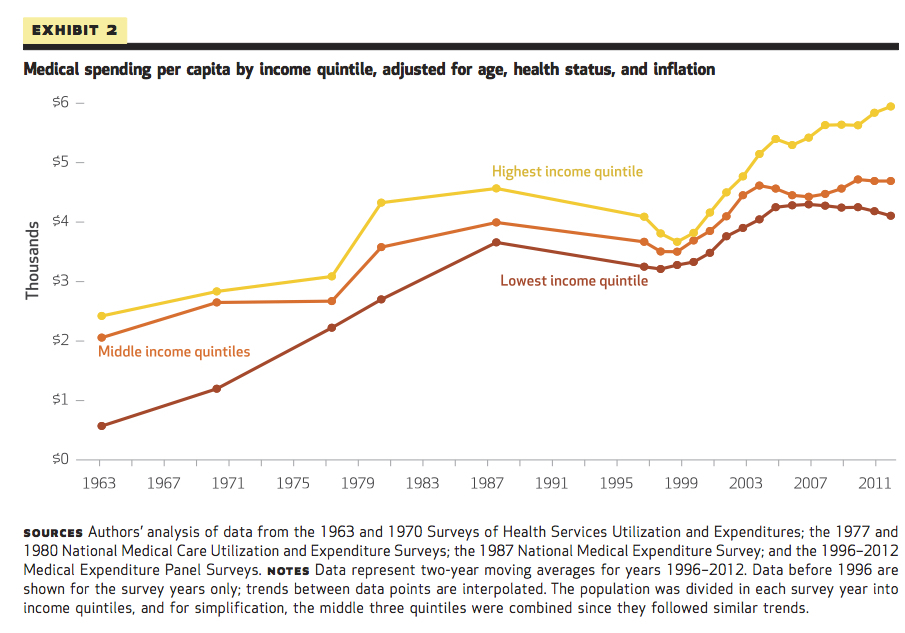
Before the 1965 passage of legislation creating Medicare and Medicaid, the lowest income quintile had the lowest expenditures, despite their worse health compared to other income groups. By 1977 the unadjusted expenditures for the lowest quintile exceeded those for all other income groups. This pattern persisted until 2004. Thereafter, expenditures fell for the lowest quintile, while rising more than 10 percent for the middle three quintiles and close to 20 percent for the highest income quintile, which had the highest expenditures in 2012. The post-2004 divergence of expenditure trends for the wealthy, middle class, and poor occurred only among the nonelderly. We conclude that the new pattern of spending post-2004, with the wealthiest quintile having the highest expenditures for health care, suggests that a redistribution of care toward wealthier Americans accompanied the health spending slowdown.
So, while the slowdown in health spending between 2004 and 2013 was widely reported and much celebrated, the breakdown by income groups suggests a sobering interpretation:
Slower spending growth (at least through 2012) was concentrated among poor and middle-income Americans, leading to a growing disparity in health expenditures across income groups.
What we’re seeing—in this pattern of sharply rising spending on healthcare by the wealthy and flat or slow growth for everyone else—is what the authors consider to be “a shift from need-based to income-based receipt of spending growth.” In other words, it represents a return to the unequal consequences of the pre-Medicaid, pre-Medicare financing of healthcare in the United Staes.
That’s the last straw. Do we really need any more arguments for universal healthcare, aka, Medicare for all?


