From David Ruccio In the second installment of this series on “class before Trumponomics,” I argued that, in recent decades, while American workers have created enormous wealth, most of the increase in that wealth has been captured by their employers and a tiny group at the top—as workers have been forced to compete with one another for new kinds of jobs, with fewer protections, at lower wages, and with less security than they once expected. And the period of recovery from the Second Great Depression has done nothing to change that fundamental dynamic. In this post, I want to focus on a more detailed analysis of the other side of the class relationship—capital. It should come as no surprise that one of the major changes in U.S. capital over the past few decades is the growing importance of financial activities. Since 1980, FIRE (finance, insurance, and real estate) has almost doubled, expanding from roughly 12 percent of the gross output of private industries to over 20 percent. And the rise in the share of corporate profits from financial activities was even more spectacular—from 10.8 percent in 1984 to a whopping 37.4 percent in 2002—and then falling during the crash, but still at a historically high 26.6 percent in 2015. By any measure, U.S.
Topics:
David F. Ruccio considers the following as important: Uncategorized
This could be interesting, too:
tom writes The Ukraine war and Europe’s deepening march of folly
Stavros Mavroudeas writes CfP of Marxist Macroeconomic Modelling workgroup – 18th WAPE Forum, Istanbul August 6-8, 2025
Lars Pålsson Syll writes The pretence-of-knowledge syndrome
Dean Baker writes Crypto and Donald Trump’s strategic baseball card reserve
from David Ruccio
In the second installment of this series on “class before Trumponomics,” I argued that, in recent decades, while American workers have created enormous wealth, most of the increase in that wealth has been captured by their employers and a tiny group at the top—as workers have been forced to compete with one another for new kinds of jobs, with fewer protections, at lower wages, and with less security than they once expected. And the period of recovery from the Second Great Depression has done nothing to change that fundamental dynamic.
In this post, I want to focus on a more detailed analysis of the other side of the class relationship—capital.

It should come as no surprise that one of the major changes in U.S. capital over the past few decades is the growing importance of financial activities. Since 1980, FIRE (finance, insurance, and real estate) has almost doubled, expanding from roughly 12 percent of the gross output of private industries to over 20 percent.

And the rise in the share of corporate profits from financial activities was even more spectacular—from 10.8 percent in 1984 to a whopping 37.4 percent in 2002—and then falling during the crash, but still at a historically high 26.6 percent in 2015.
By any measure, U.S. capital became increasingly oriented toward finance beginning in the early 1980s—as traditional banks (deposit-gathering commercial banks), non-bank financial entities (especially shadow banking, such as investment banks, hedge funds, insurers and other non-bank financial institutions), and even the financial arm of industrial corporations (such as the General Motors Acceptance Corporation, now Ally Financial) absorbed and then profited by creating new claims on the surplus.
This process of “financialization” was the flip side of the decreasing labor share in the U.S. economy: On one hand, stagnant wages meant both an increasing surplus, which could be recycled via the financial sector, and a growing market for loans, as workers sought to maintain their customary level of consumption via increasing indebtedness. On the other hand, the production of commodities (both goods and services) became less important than capturing a portion of the surplus from around the world, and utilizing it via issuing loans and selling derivatives to receive even more.

Not only did finance become increasingly internationalized, so did the U.S. economy as a whole. As a result of employers’ decisions to outsource the production of commodities that had previously been manufactured in the United States and to find external markets for the sale of other commodities (especially services), and with the assistance of the lowering of tariffs and the signing of new trade agreements, the U.S. economy was increasingly opened up from the early-1970s onward. One indicator of this globalization is the increase in the weight of international trade (the sum of exports and imports) in relation to U.S. GDP—more than tripling between 1970 (9.33 percent) to 2014 (29.1 percent).

The third major change in U.S. capital in recent decades is a rise in the degree of corporate concentration and centralization—to such an extent even the President’s Council of Economic Advisers (pdf) has taken notice. A wave of mergers and acquisitions has made firms larger and has increased the degree of market concentration within a broad range of industries. In finance, for example, the market share of the five largest banks (measured in terms of their assets as a share of total commercial banking assets) more than doubled between 1996 and 2014—rising from 23.2 percent to 47.9 percent.
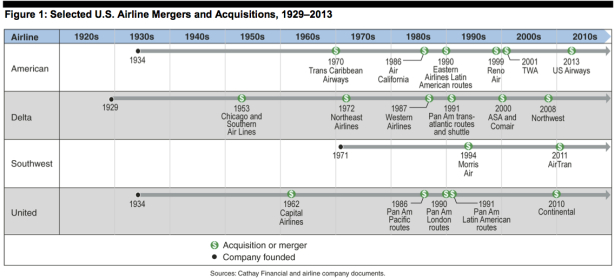
The U.S. airline industry also experienced considerable merger and acquisition activity, especially following deregulation in 1978. The figure above (from a report by the U.S. Government Accountability Office [pdf]) provides a timeline of mergers and acquisitions for the four largest surviving domestic airlines—American, Delta, Southwest, and United—based on the number of passengers served. These four airlines accounted for approximately 85 percent of total passenger traffic in the United States in 2013.
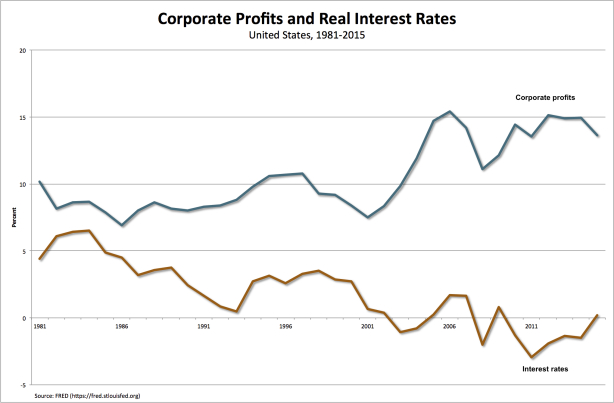
Another piece of evidence that concentration and centralization have increased within the U.S. economy is (following Jason Furman) the growing gap between corporate profits and interest-rates. The fact that corporate profits (as a share of national income, the top line in the chart above) have risen while interest-rates (the nominal constant-maturity 1-year rate estimated by the Federal Reserve, less inflation defined by the Consumer Price Index, the bottom line in the chart above) indicates that the portion of profits created by oligopoly rents has grown in recent decades.*

Together, the three main tendencies I have highlighted—financialization, internationalization, and corporate rents—indicate a fundamental change in U.S. capital since the 1980s, which has continued during the current recovery. One of the effects of those changes is a decline in the importance of manufacturing, especially in relation to FIRE, as can be seen in the chart above. Manufacturing (as measured by value added as a percentage of GDP) has declined from 22.9 percent (in 1970) to 12 percent (in 2015), while FIRE moved in the opposite direction—from 14.2 percent to 20.3 percent. Quantitatively, the two sectors have traded places, which qualitatively signifies a change in how U.S. capital manages to capture the surplus. While it still appropriates surplus from its own workers (although now more in the production and export of services than in manufacturing), it now captures the surplus, from workers inside and outside the United States, via financial activities. On top of that, the largest firms are capturing additional portions of the surplus from other, smaller corporations via oligopoly rents.

What we’ve witnessed then is a fundamental transformation of U.S. capital and thus the U.S. economy, which begins to explain a whole host of recent trends—from the decrease in rates of economic growth (since capital is engaged less in investment than in other activities, such as stock buybacks, hoarding profits in the form of cash, and mergers and acquisitions) to the rise in corporate executive pay in relation to average worker pay (which has ballooned, from 29.9 in 1978 to 275.6 in 2015).
What is clear is that the decisions of U.S. capital as it changed over the course of recent decades created the conditions for the crash of 2007-08 and the unevenness of the subsequent recovery, which culminated in the victory of Donald Trump in November 2016.
*Another way to get at these oligopoly rents is to distinguish between the capital share and the profit share. According to Simcha Barkai (pdf), the decline in the labor share over the last 30 years was not offset by an increase in the capital share, which actually declined. But it was accompanied by an increase in the profit share, due to a rise in mark-ups.