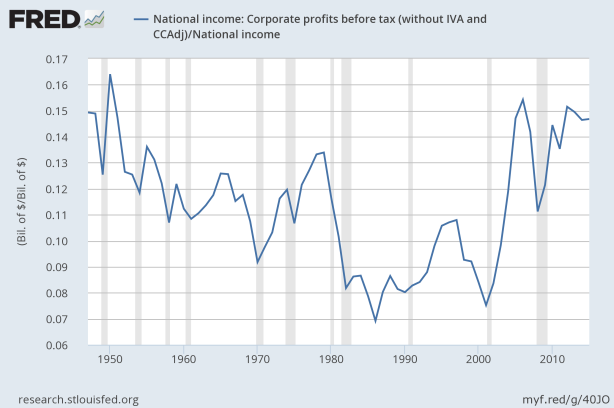
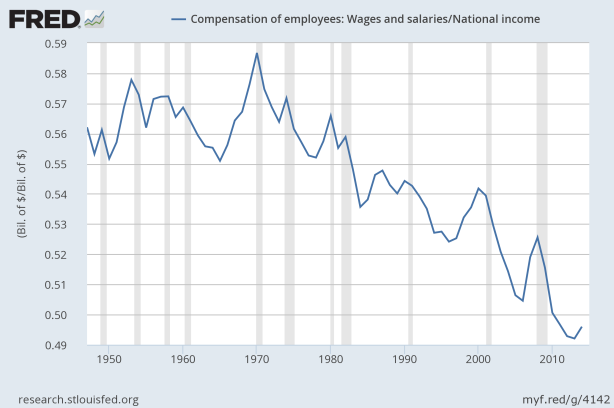
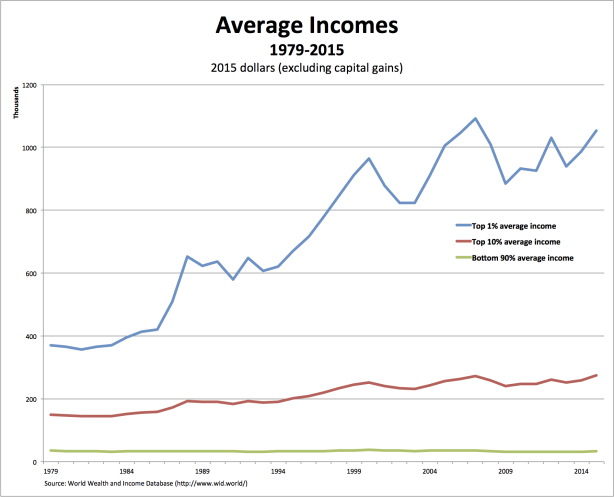
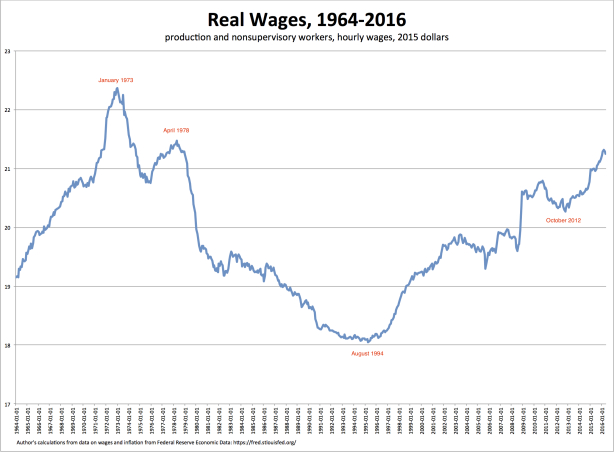
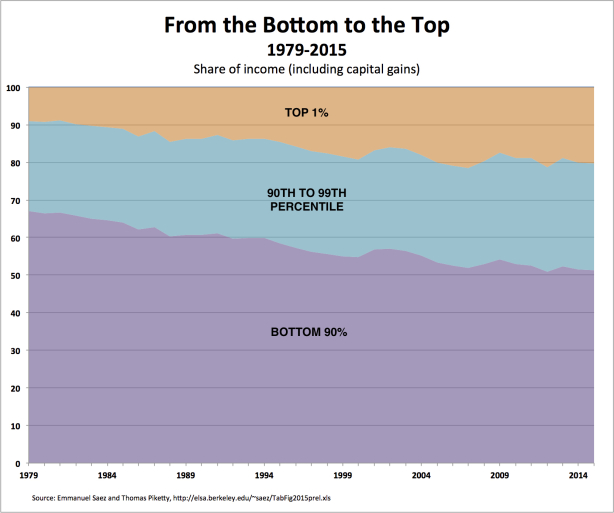
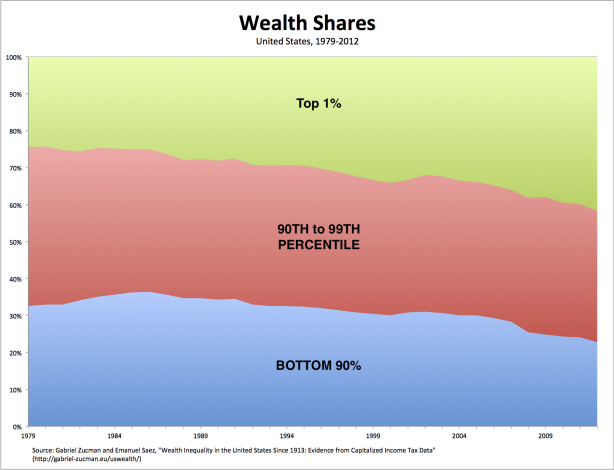
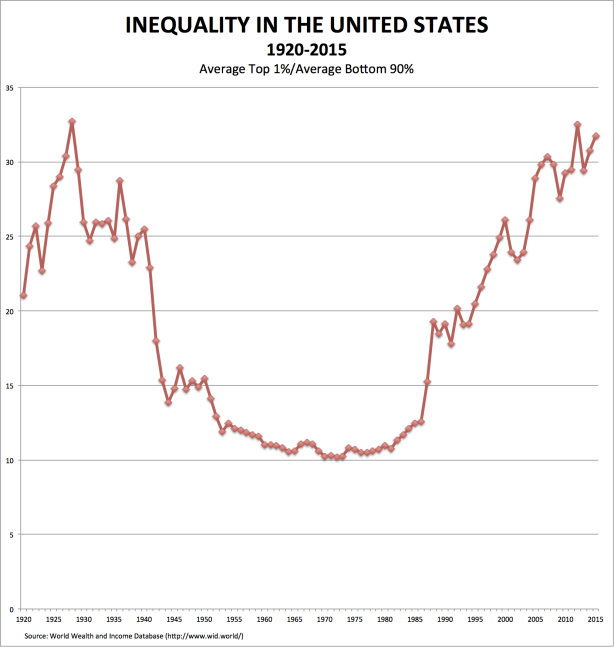
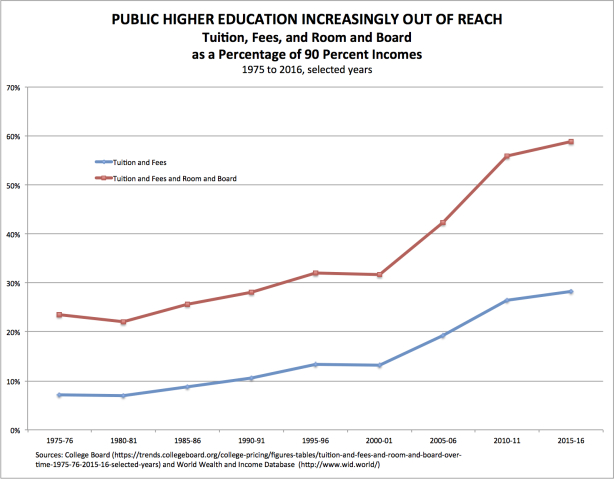
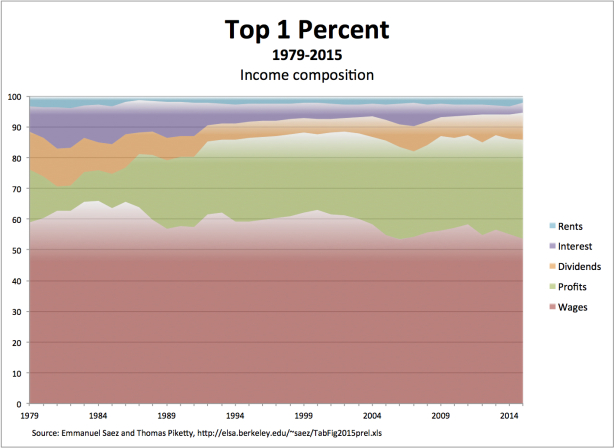
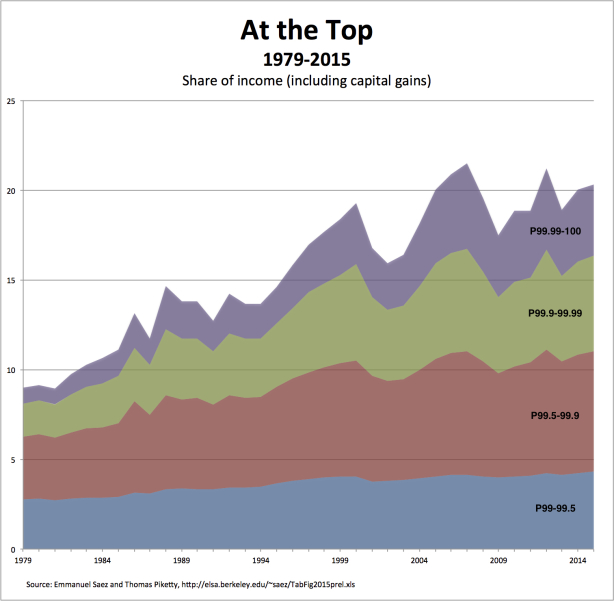
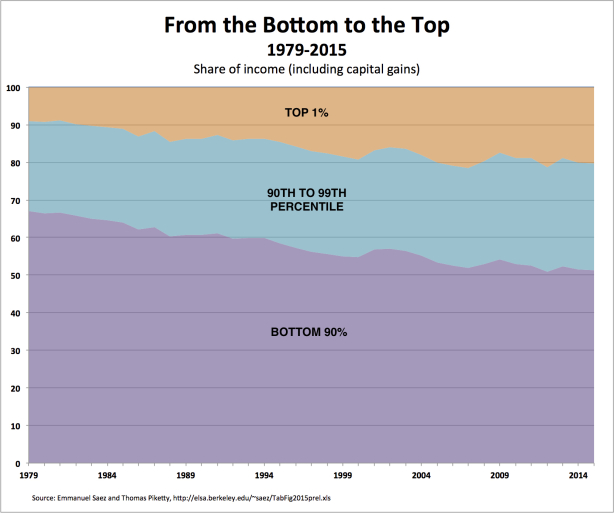
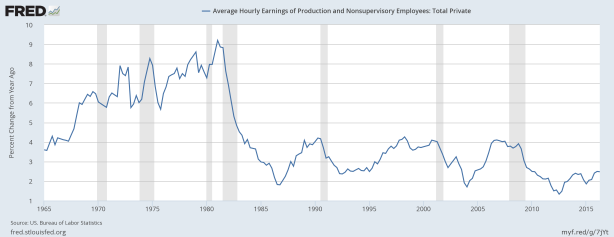
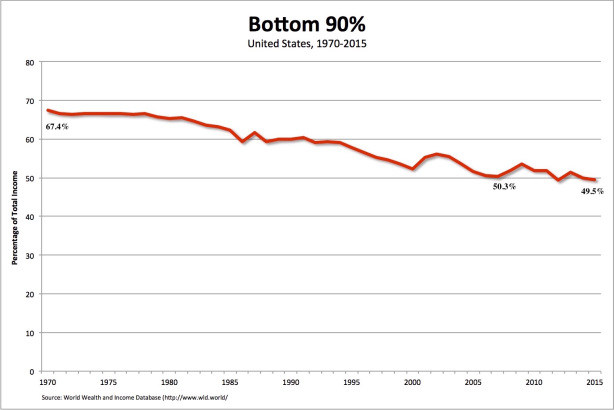
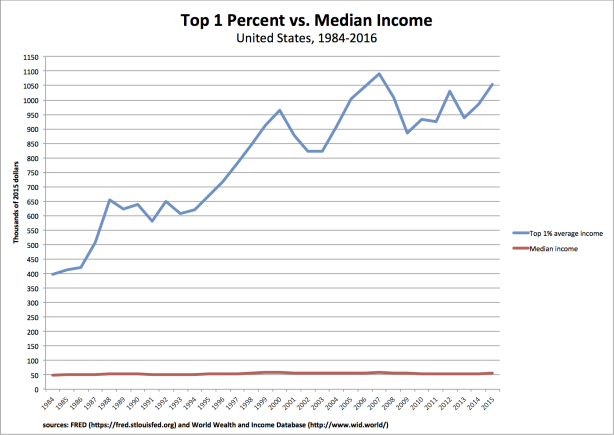
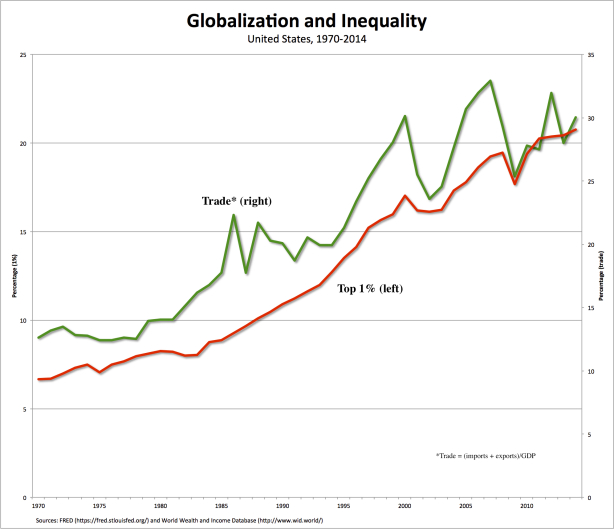
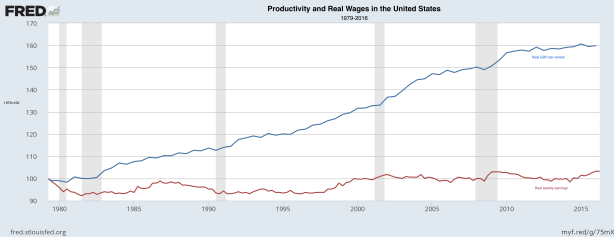
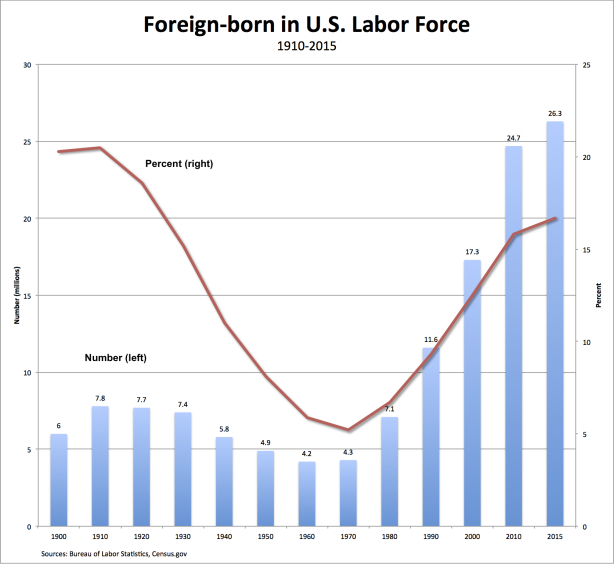
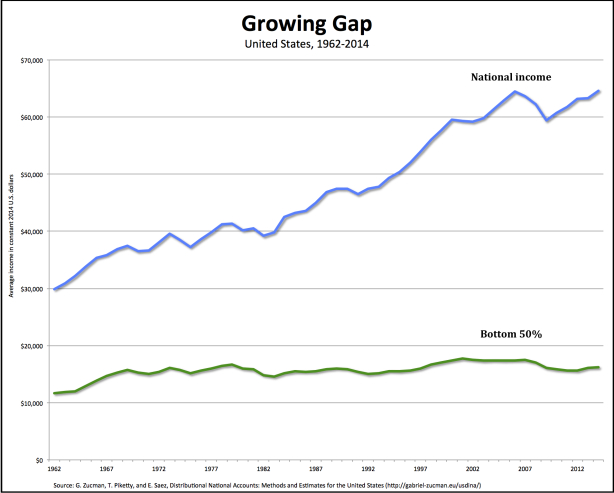
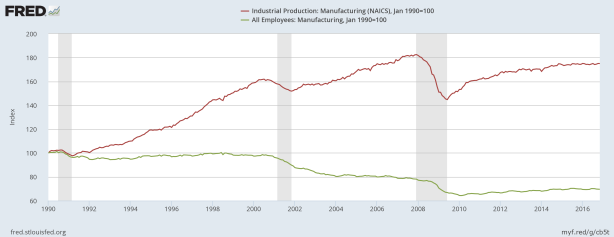
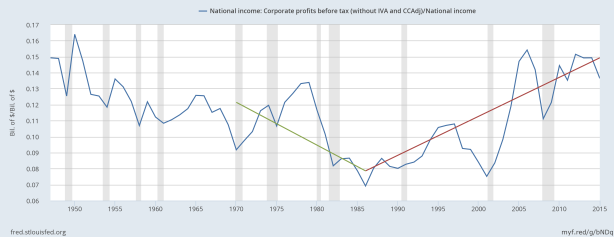
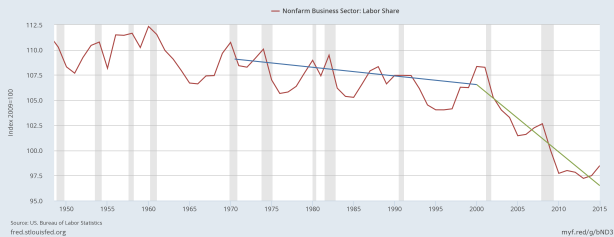
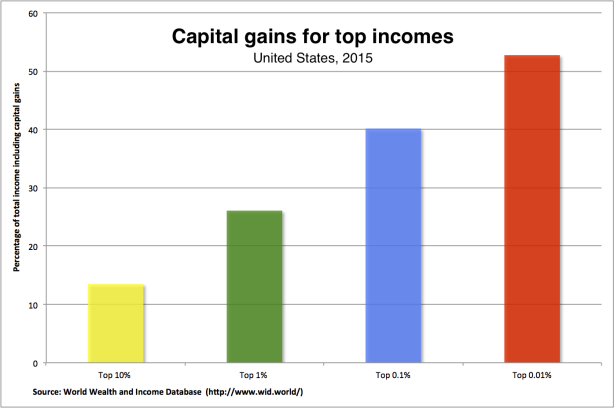
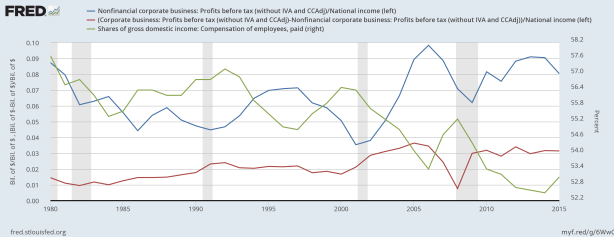
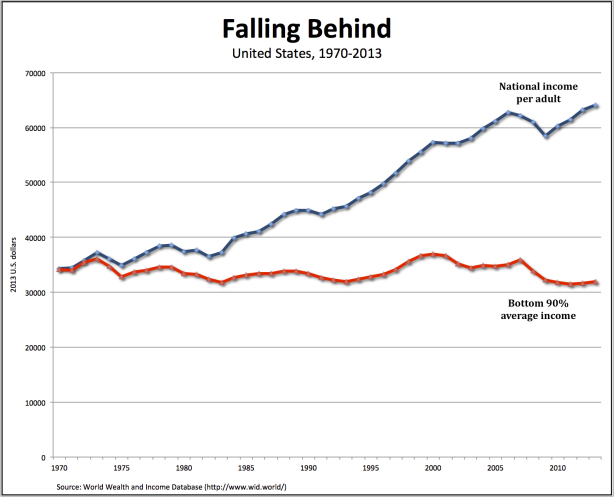
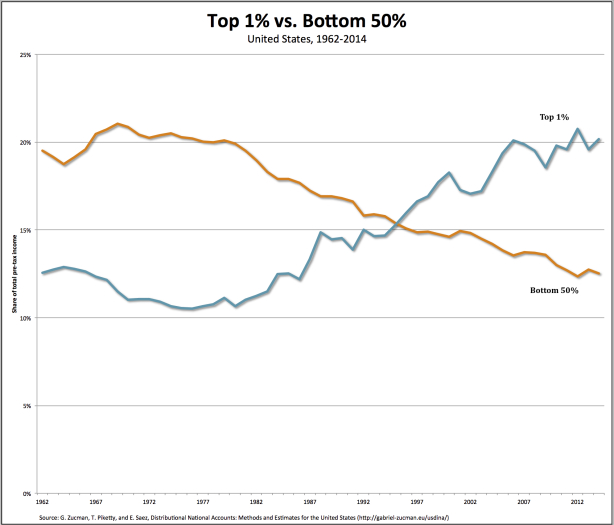
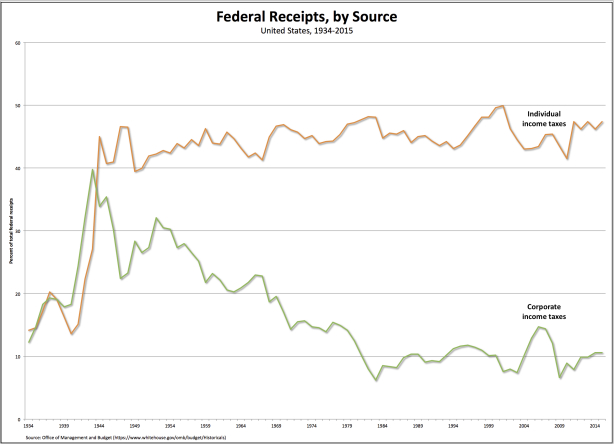
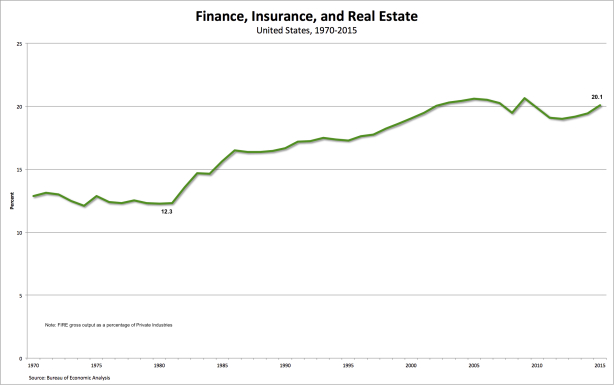
From David Ruccio As regular readers of this blog know, I try to make available and critically interpret charts of data—both to challenge others’ arguments and to provide a foundation for my own. Last year, I spent much more time using publicly available data to make my own charts, which readers are free to use for their own purposes. Here are some of those charts (just click on each chart to go to the post in which it originally appeared).
Topics:
David F. Ruccio considers the following as important: Uncategorized
This could be interesting, too:
tom writes The Ukraine war and Europe’s deepening march of folly
Stavros Mavroudeas writes CfP of Marxist Macroeconomic Modelling workgroup – 18th WAPE Forum, Istanbul August 6-8, 2025
Lars Pålsson Syll writes The pretence-of-knowledge syndrome
Dean Baker writes Crypto and Donald Trump’s strategic baseball card reserve
from David Ruccio
As regular readers of this blog know, I try to make available and critically interpret charts of data—both to challenge others’ arguments and to provide a foundation for my own.
Last year, I spent much more time using publicly available data to make my own charts, which readers are free to use for their own purposes.
Here are some of those charts (just click on each chart to go to the post in which it originally appeared).


