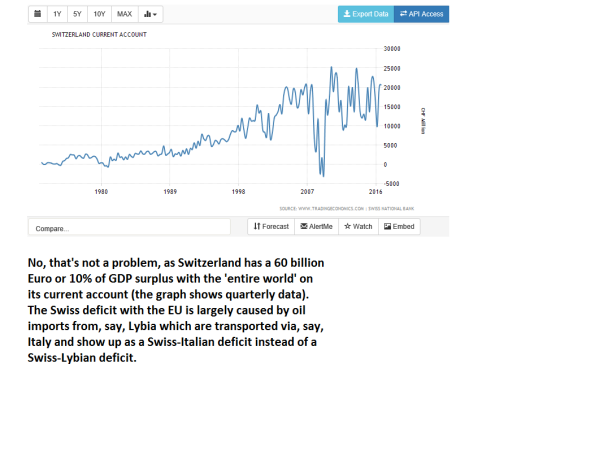
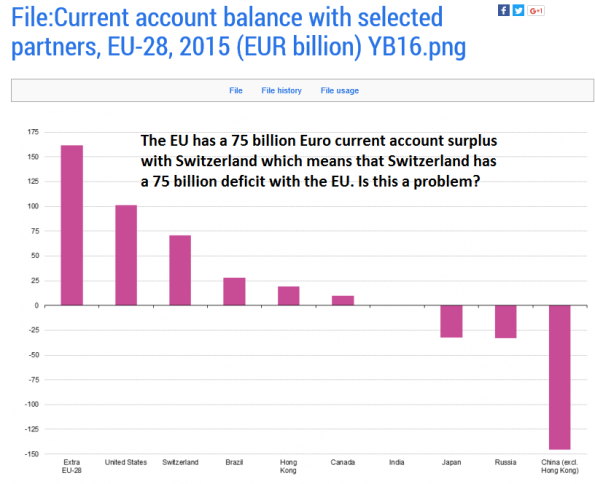
Today: 2 graphs. And do I really have to write this blog? Yes, I have. At this moment the USA government seems to target bilateral trade balances: these should be more or less balanced. To quote a Trumptweet (January 27, 2017): “The U.S. has a 60 billion dollar trade deficit with Mexico. It has been a one-sided deal from the beginning of NAFTA with massive numbers…”. But it does not work that way. Bilateral trade deficits are not the right measure to estimate if trade is one-sided deal. Switzerland is an example. This landlocked country has a massive current account deficit with the EU (graph above) but a massive current account surplus with the rest of the world. As it imports oil (in fact: oil products) via EU countries which is counted as an import and an export of these EU countries but only as an import of Switzerland. In a ‘real goods’ sense, this is a deficit with oil-producing countries. But we’re not living in a ‘real goods’ world but in a monetary world. but in a monetary world. As for the US of A: as long as the USA currency is as important as it is now there will be a large demand for US of A money. which means that the USA of A is in fact not lending money to other countries but actually selling money to people abroad who want to store dollars. Which shows up as a deficit on the current account.
Topics:
Merijn T. Knibbe considers the following as important: Uncategorized
This could be interesting, too:
tom writes The Ukraine war and Europe’s deepening march of folly
Stavros Mavroudeas writes CfP of Marxist Macroeconomic Modelling workgroup – 18th WAPE Forum, Istanbul August 6-8, 2025
Lars Pålsson Syll writes The pretence-of-knowledge syndrome
Dean Baker writes Crypto and Donald Trump’s strategic baseball card reserve
Today: 2 graphs. And do I really have to write this blog? Yes, I have. At this moment the USA government seems to target bilateral trade balances: these should be more or less balanced. To quote a Trumptweet (January 27, 2017): “The U.S. has a 60 billion dollar trade deficit with Mexico. It has been a one-sided deal from the beginning of NAFTA with massive numbers…”. But it does not work that way. Bilateral trade deficits are not the right measure to estimate if trade is one-sided deal. Switzerland is an example.
This landlocked country has a massive current account deficit with the EU (graph above) but a massive current account surplus with the rest of the world. As it imports oil (in fact: oil products) via EU countries which is counted as an import and an export of these EU countries but only as an import of Switzerland. In a ‘real goods’ sense, this is a deficit with oil-producing countries. But we’re not living in a ‘real goods’ world but in a monetary world. but in a monetary world. As for the US of A: as long as the USA currency is as important as it is now there will be a large demand for US of A money. which means that the USA of A is in fact not lending money to other countries but actually selling money to people abroad who want to store dollars. Which shows up as a deficit on the current account. What a privilege (I first encountered this idea in an article of Cornelis Jepma from around 1985 which I could not trace on the internet – it’s not really a new insight!). The Vatican sells stamps to cover its current account deficit, the USA sells dollars. And bilateral trade balances are interesting – but not in the way the Trumpistas think they are. Sources: Eurostat, Tradingeconomics.