From David Ruccio This semester, we’re teaching A Tale of Two Depressions, a course designed as a comparison of the first and second Great Depressions in the United States. And one of the themes of the course is that, in considering the conditions and consequences of the two depressions, we’re talking about a tale of two countries. As it turns out, the tale of two countries may be even more true in the case of the most recent crises of capitalism. That’s because the two countries were growing apart in the decades leading up to the crash—and the gap has continued growing afterward. It seems we learned even less than we thought about the first Great Depression. Or maybe those at the top learned even more. As Thomas Piketty, Emmanuel Saez, and Gabriel Zucman remind us, Because the pre-tax incomes of the bottom 50% stagnated while average national income per adult grew, the share of national income earned by the bottom 50% collapsed from 20% in 1980 to 12.5% in 2014. Over the same period, the share of incomes going to the top 1% surged from 10.7% in 1980 to 20.2% in 2014. What is clear from the data illustrated in the chart at the top of the post, these two income groups basically switched their income shares, with about 8 points of national income transferred from the bottom 50 percent to the top 1 percent.
Topics:
David F. Ruccio considers the following as important: Uncategorized
This could be interesting, too:
tom writes The Ukraine war and Europe’s deepening march of folly
Stavros Mavroudeas writes CfP of Marxist Macroeconomic Modelling workgroup – 18th WAPE Forum, Istanbul August 6-8, 2025
Lars Pålsson Syll writes The pretence-of-knowledge syndrome
Dean Baker writes Crypto and Donald Trump’s strategic baseball card reserve
from David Ruccio
This semester, we’re teaching A Tale of Two Depressions, a course designed as a comparison of the first and second Great Depressions in the United States. And one of the themes of the course is that, in considering the conditions and consequences of the two depressions, we’re talking about a tale of two countries.
As it turns out, the tale of two countries may be even more true in the case of the most recent crises of capitalism. That’s because the two countries were growing apart in the decades leading up to the crash—and the gap has continued growing afterward.
It seems we learned even less than we thought about the first Great Depression. Or maybe those at the top learned even more.
As Thomas Piketty, Emmanuel Saez, and Gabriel Zucman remind us,
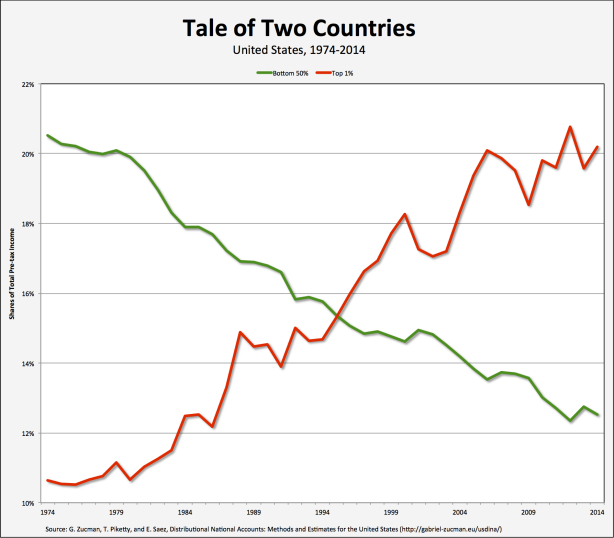
Because the pre-tax incomes of the bottom 50% stagnated while average national income per adult grew, the share of national income earned by the bottom 50% collapsed from 20% in 1980 to 12.5% in 2014. Over the same period, the share of incomes going to the top 1% surged from 10.7% in 1980 to 20.2% in 2014.
What is clear from the data illustrated in the chart at the top of the post, these two income groups basically switched their income shares, with about 8 points of national income transferred from the bottom 50 percent to the top 1 percent.
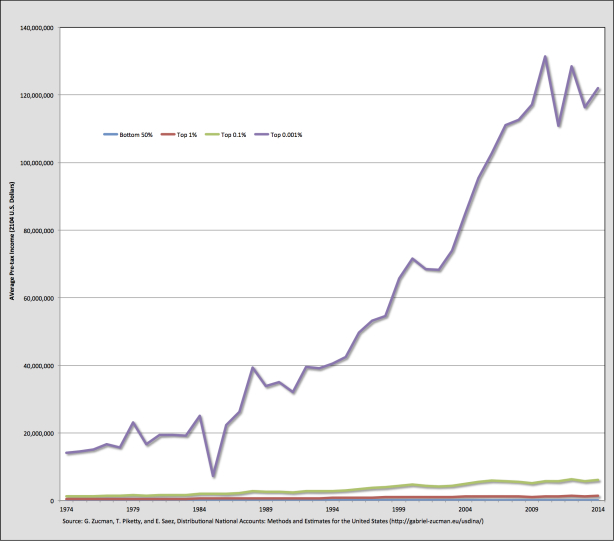
The consequence is that the bottom half of the income distribution in the United States has been completely shut off from economic growth since the 1970s. From 1980 to 2014, average national income per adult grew by 61 percent in the United States, yet the average pre-tax income of the bottom 50 percent of individual income earners stagnated at about $16,000 per adult after adjusting for inflation, which barely registers on the chart above. In contrast, income skyrocketed at the top of the income distribution, rising 205 percent for the top 1%, 321 percent for the top 0.01%, and 636 percent for the top 0.001%.
Clearly, “an economy that fails to deliver growth for half of its people for an entire generation”—and, I would add, distributes the growth that has occurred to a tiny group at the top—”is bound to generate discontent with the status quo and a rejection of establishment politics.”


