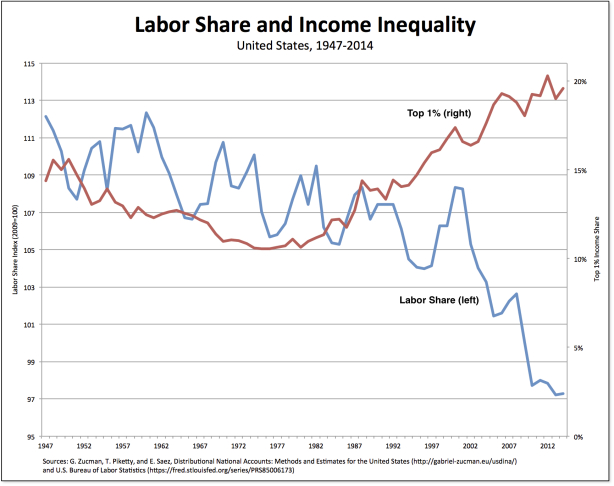
From David Ruccio John Hatgioannides, Marika Karanassou, and Hector Sala are absolutely right: mainstream macroeconomists and policymakers never venture beyond the “holy trinity” of economic growth, inflation, and unemployment.* Everything else, including the distribution of income and wealth, is relegated to the fringes. This problem, while always serious, has been magnified in recent decades as inequality has grown to obscene levels, particularly in the United States. The labor share (the blue line in the chart above) has been falling since 1960 and, in the past decade and a half, it dropped an astounding 10.2 percent. Meanwhile, the share of income captured by the top 1 percent (the red line in the chart) has soared, rising from 10.5 percent in 1976 to 19.6 percent in 2014. In
Topics:
David F. Ruccio considers the following as important: Uncategorized
This could be interesting, too:
tom writes The Ukraine war and Europe’s deepening march of folly
Stavros Mavroudeas writes CfP of Marxist Macroeconomic Modelling workgroup – 18th WAPE Forum, Istanbul August 6-8, 2025
Lars Pålsson Syll writes The pretence-of-knowledge syndrome
Dean Baker writes Crypto and Donald Trump’s strategic baseball card reserve
from David Ruccio
John Hatgioannides, Marika Karanassou, and Hector Sala are absolutely right: mainstream macroeconomists and policymakers never venture beyond the “holy trinity” of economic growth, inflation, and unemployment.* Everything else, including the distribution of income and wealth, is relegated to the fringes.
This problem, while always serious, has been magnified in recent decades as inequality has grown to obscene levels, particularly in the United States. The labor share (the blue line in the chart above) has been falling since 1960 and, in the past decade and a half, it dropped an astounding 10.2 percent. Meanwhile, the share of income captured by the top 1 percent (the red line in the chart) has soared, rising from 10.5 percent in 1976 to 19.6 percent in 2014.
In order to rectify the problem, Hatgioannides, Karanassou, and Sala propose to bring inequality in from the margins as the “missing fourth statistic.”
They focus particular attention on inequality in relation to tax contributions. But they do so in the manner that departs from the usual discussion, which leaves the discussion at absolute income tax contributions (such as the share of income taxes paid by each economic group). Those are the numbers we often hear or read, which seek to show how progressive the U.S. tax system is. For example, according to the Tax Foundation, the top 1 percent paid a greater share of individual income taxes (39.5 percent) than the bottom 90 percent combined (29.1 percent).
Instead, Hatgioannides, Karanassou, and Sala concentrate on the ratio of the average income tax per given income group divided by the percentage of national income captured by the same income group (what they call the Effective Income Tax contribution), whence they calculate an inequality index (the Fiscal Inequality Coefficient).
What the Fiscal Inequality Coefficient shows is the relative contribution of filling the fiscal coffers for different pairs of income groups.
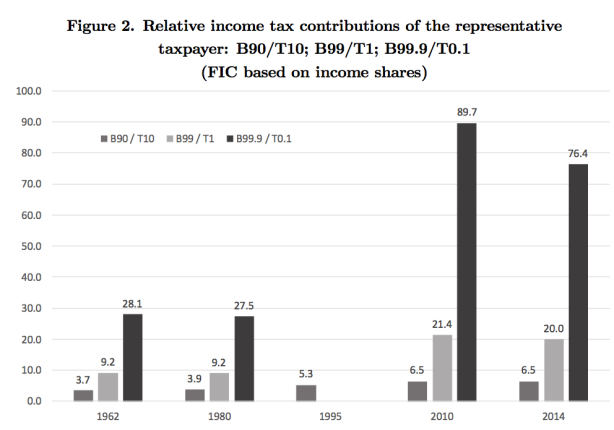
In the figure above, they plot the Fiscal Inequality Coefficient based on income shares (they also report a related index based on wealth), of the bottom 90 percent versus the top 10 percent, the bottom 99 percent versus the top 1 percent, and the bottom 99.9 percent versus the top 0.1 percent for 1962, 1980, 1995, 2010, and 2014.
Thus, for example, the Fiscal Inequality Coefficient based on income shares remains relatively constant for all pairs for years 1962 and 1980 but increases significantly by 2010—with the bottom 90 percent effectively contributing 6.5 times more than the top 10 percent, the bottom 99 percent 21.4 times more than the top 1 percent, and the bottom 99.9 percent effectively contributing 89.7 times more than the top 0.1 percent.**
Clearly, the relative income tax burden for those at the top has fallen over time, demonstrating that the U.S. tax system has become less, not more, progressive.
And the authors’ conclusion?
In the current era of fiscal consolidation should the rich be taxed more? Our evidence suggests unequivocally yes.
*Their paper is discussed in the Guardian by Larry Elliott. The submitted version of their article is available here.
**The results are even more dramatic if one calculates the Fiscal Inequality Coefficient based on household wealth shares: in the year 2010, the Bottom 99.9 percent contributed 208.9 times more than the Top 0.1 percent, nearly four times more than what it was in 1980!


