From David Ruccio and Jamie Morgan and the current issue of RWER If we return to the World Inequality Lab, the share for the top 1 percent in the United States is higher than the global figure. It was, for example, an astounding 41.8 percent in 2012 and 35 percent in 2014 (compared to 45.3 percent for the bottom 90 percent of households) However, depending on how it is measured, actual wealth inequality may be even higher. Both the World Inequality Lab and the Federal Reserve (in the Survey of Consumer Finances) include housing and retirement pensions in household wealth – and those two categories comprise most of the so-called wealth of most Americans. The important point is that they don’t own much in the way of financial or business wealth. They live in their houses and they
Topics:
Editor considers the following as important: Uncategorized
This could be interesting, too:
tom writes The Ukraine war and Europe’s deepening march of folly
Stavros Mavroudeas writes CfP of Marxist Macroeconomic Modelling workgroup – 18th WAPE Forum, Istanbul August 6-8, 2025
Lars Pålsson Syll writes The pretence-of-knowledge syndrome
Dean Baker writes Crypto and Donald Trump’s strategic baseball card reserve
from David Ruccio and Jamie Morgan and the current issue of RWER
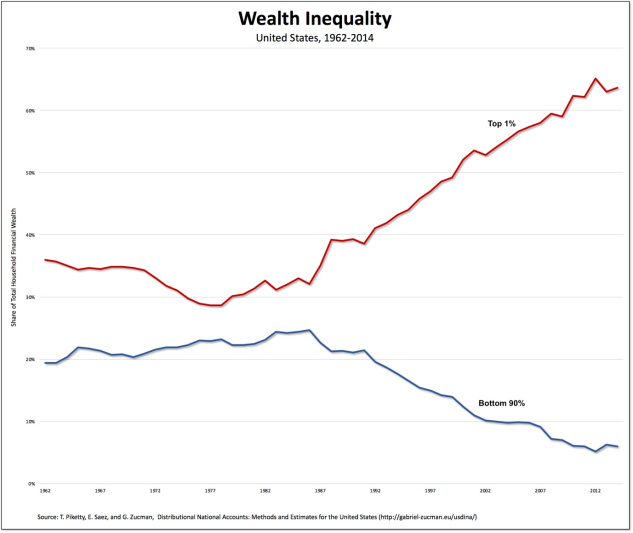
If we return to the World Inequality Lab, the share for the top 1 percent in the United States is higher than the global figure. It was, for example, an astounding 41.8 percent in 2012 and 35 percent in 2014 (compared to 45.3 percent for the bottom 90 percent of households) However, depending on how it is measured, actual wealth inequality may be even higher.
Both the World Inequality Lab and the Federal Reserve (in the Survey of Consumer Finances) include housing and retirement pensions in household wealth – and those two categories comprise most of the so-called wealth of most Americans. The important point is that they don’t own much in the way of financial or business wealth. They live in their houses and they retire based on contributions from their wages and salaries over the course of their work lives. They own little in the way of equities, fixed-income claims and business assets, which we can refer to independently as real wealth (in so far as this wealth is something they can additionally call upon beyond specific retirement products or their home). If we take out housing and pensions and calculate just the shares of financial or business wealth – and, thus, equities, fixed-income claims, and business assets – the degree of inequality is much, much worse. According to my calculations, in 2014 the top 1 percent owned almost two thirds of the financial or business wealth, while the bottom 90 percent had only six percent. That represents an enormous change from the already-unequal situation in 1978, when the shares were much closer (28.6 percent for the top 1 percent and 23.2 percent for the bottom 90 percent):[1]
What does this mean? The majority do not have the ability to amass any real wealth; put another way, they produce most of the wealth but don’t take home any of the surplus. For the small group at the top, things are quite different. They do get a cut of the surplus, which they use, not only to purchase housing and put aside in their pensions, but to accumulate real wealth, for themselves and their families. Moreover, as the labour share declines and the profit share increases, this is exacerbated. This is the background against which wages and incomes stagnate or fall for the majority, a trend that has continued throughout the “recovery” since the global financial crisis. read more
[1] https://anticap.files.wordpress.com/2018/02/wealth-inequality.jpg