From C. P. Chandrasekhar and Jayati Ghosh Figure 1: India has very unequal wealth distribution Source: Credit Suisse Global Wealth Report, 2018. India is often mistakenly seen as a country with relatively low economic inequality. In fact, there were always very significant economic inequalities in India, which intersected with social and locational inequalities in complex ways. More significantly, the country’s inequalities widened after the internal and external economic liberalization measures from the early 1990s, which attracted global financial investors and boosted economic growth considerably. The estimates of low inequality are usually based on the fact that the Gini coefficients of consumption expenditure have not been so high in India (although they have increased over
Topics:
Editor considers the following as important: Uncategorized
This could be interesting, too:
tom writes The Ukraine war and Europe’s deepening march of folly
Stavros Mavroudeas writes CfP of Marxist Macroeconomic Modelling workgroup – 18th WAPE Forum, Istanbul August 6-8, 2025
Lars Pålsson Syll writes The pretence-of-knowledge syndrome
Dean Baker writes Crypto and Donald Trump’s strategic baseball card reserve
from C. P. Chandrasekhar and Jayati Ghosh
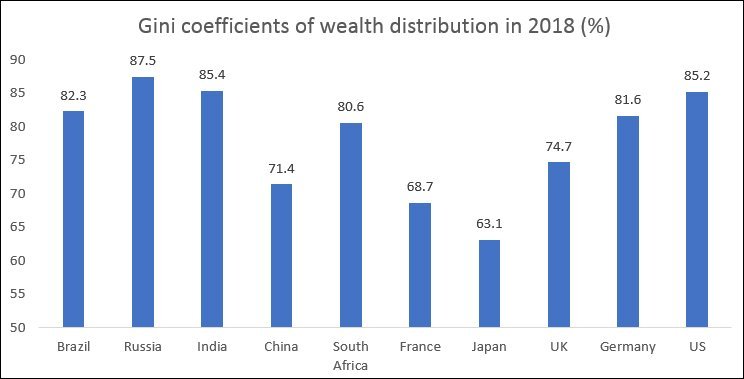
Figure 1: India has very unequal wealth distribution
 Source: Credit Suisse Global Wealth Report, 2018.
India is often mistakenly seen as a country with relatively low economic inequality. In fact, there were always very significant economic inequalities in India, which intersected with social and locational inequalities in complex ways. More significantly, the country’s inequalities widened after the internal and external economic liberalization measures from the early 1990s, which attracted global financial investors and boosted economic growth considerably.
The estimates of low inequality are usually based on the fact that the Gini coefficients of consumption expenditure have not been so high in India (although they have increased over time). The National Sample Survey data on which such estimates are based tend to understate the extent of inequality because they underestimate the tails of the distribution, excluding the very rich and the very poor. Further, the poor are more likely to consume their income or even more, while the rich can save out of their incomes. Official survey data indicate that the Gini coefficient increased from 31 per cent in 1993-1994 to around 34 per cent in 2011-2012, but this is clearly an underestimate of even the extent of consumption inequality. The further limitation is that data are only available up to the last large sample survey that was undertaken in 2011-12.
Predictably, income inequality estimates reveal greater inequality. The India Human Development Surveys of 2004-05 and 2011-12, which provide longitudinal information on a reasonably large sample of households, suggest a Gini coefficient of 55 per cent, which is not only much higher than that for consumption, but also similar to countries generally seen as very unequal, like Brazil.
But the wealth inequality in India is only too apparent. India has one of the most unequal wealth distributions in the world. The annual Global Wealth Report brought out by Credit Suisse indicates that the Gini coefficient of wealth distribution in India estimated in 2018 was as high as 85.4 per cent (Figure 1). This was only slightly below that of Russia (widely recognised to be the most unequal) and even slightly above Brazil and the United States, where wealth inequalities are much discussed.
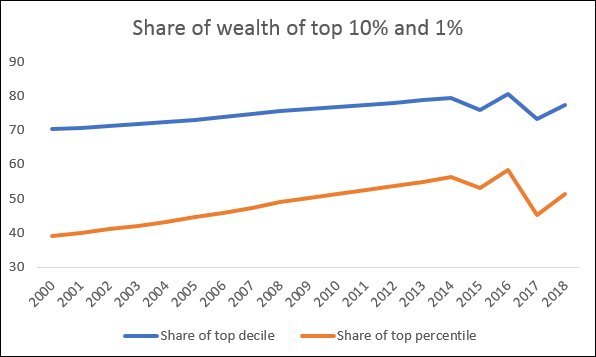
What is more, such wealth inequalities also increased over time in India, as shown in Figure 2. The top decile increased its share of estimated wealth from 70 per cent in 2000 to nearly 82 per cent in 2016, and since then its share has fallen only marginally to 77.4 per cent in 2018. Meanwhile the trend in the share of the top 1 percentile is even more shocking: from 39 per cent to as much as 58.4 per cent in 2016, going down since then (largely because of changes in stock market valuations etc.) to around 52 per cent.
Figure 2: The wealthy got even wealthier since 2000
Source: Credit Suisse Global Wealth Report, various issues.
So only 1 per cent of Indian holds more than half of the estimated wealth of the country. Incidentally, this also refers to the recorded wealth held within the country, but it is safe to assume that many of these rich persons also hold significant wealth abroad.
What is more, this category of highly privileged rich people also manages to avoid or evade taxes in India. Estimates by Lucas Chancel and Thomas Piketty suggest that the top 1 per cent of the population account for around 22 per cent of the country’s income. They use a combination of data from tax returns, consumption and income surveys and national accounts data, and extrapolate their numbers to more recent years, using the tax data. Their results show a really startling increase in income inequality in the past decade in particular.
So, after a period of nearly half a century after Independence, when income share fluctuated around a broadly flat trend, there was a significant break in trend in the period of globalisation and neoliberal economic reforms. The figure points to a dramatic increase in the share of the top decile from 1990 but especially after 2000, mirrored by a decrease in the share of the middle 40 per cent. The share of the bottom half of the population also fell over this period. The share of the top 1 per cent of the population crossed that of the entire bottom half of the population somewhere in the mid-2000s, and since then the gap between the income shares of these groups has widened much further.
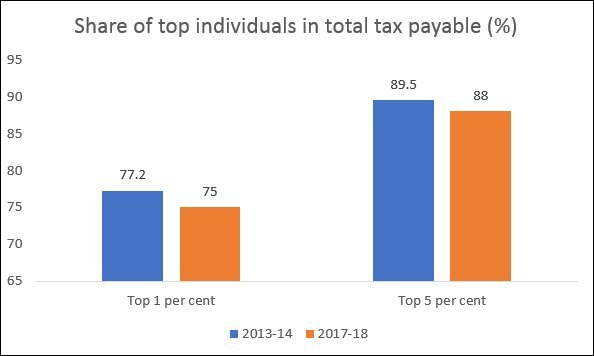
This sharp inequality is reflected in tax collections. The overwhelming majority of individuals either fall below the minimum tax threshold, while a much smaller proportion or are able to conceal their incomes to avoid paying tax. As it is, only around 1.7 per cent of the Indian population pay income tax. However, even within the group of tax payers, there are significant inequalities, as workers and salaried persons at the bottom of the scale whose taxes are paid out of their wage incomes have much lower incomes than the top tax payers. But even within this limited group, as Figure 3 shows, the richest pay a falling share of the income taxes.
Figure 3: The richest individuals pay a falling share of income taxes

Source: Central Board of Direct Taxes, 2018.
The Credit Suisse Report implies that around 3,500 Indians hold wealth that would provide annual rentier incomes in excess of Rs 500 crore. But the CBDT data show that only 179 individuals reported this level of income in 2017-18. Clearly, the only way to deal with this poor level of self-reportage is with proper investigation by an efficient and honest tax administration. But this requires genuine political will to tax the rich, not bombastic statements that are not backed by any real actions.
The inability to tax high net worth individuals – or to collect corporation tax from profitable companies as expected – in turn means that the government has turned to relying more and more on indirect taxation. This is much more regressive and puts the burden of raising fiscal resources onto common people. The share of direct taxes in total tax revenues has fallen from 38 per cent in 2009-10 (under the currently much-maligned UPA government) to only 32 per cent in 2017-18.
It is no secret that India has some outrageously rich people whose incomes should and could be taxed to provide revenues for important public spending. But it is also increasingly not a secret that this government has no desire to do this.
(This article was originally published in the Business Line on November 6, 2018)
