Source: Bureau of Labor Statistics Broad unemployment today is, compared with the period before 1994, worse than you think. A new way of estimating ‘part time workers for economic reasons’ shifted this series downward with almost 1% of the labor force. To gain a proper understanding of historical developments present day data have to be increased or historical data have to be decreased a little. I’m trying to write a book about the relation between economic statistics and neoclassical econ. It’s not going fast: how do you explain to non econ’s why when people like Robert Lucas or Edward Prescott (both Nobel prize winners) write ‘leisure’ they actually mean what you and I call ‘unemployment’…. Anyway, to convince such people that ‘involuntary unemployment’ exist, I was writing a
Topics:
Merijn T. Knibbe considers the following as important: Uncategorized
This could be interesting, too:
tom writes The Ukraine war and Europe’s deepening march of folly
Stavros Mavroudeas writes CfP of Marxist Macroeconomic Modelling workgroup – 18th WAPE Forum, Istanbul August 6-8, 2025
Lars Pålsson Syll writes The pretence-of-knowledge syndrome
Dean Baker writes Crypto and Donald Trump’s strategic baseball card reserve
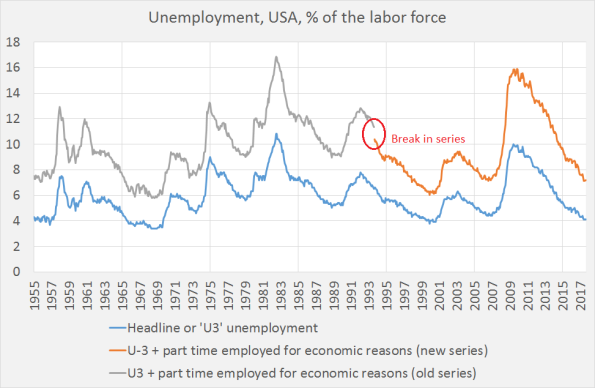
Source: Bureau of Labor Statistics
Broad unemployment today is, compared with the period before 1994, worse than you think. A new way of estimating ‘part time workers for economic reasons’ shifted this series downward with almost 1% of the labor force. To gain a proper understanding of historical developments present day data have to be increased or historical data have to be decreased a little.
I’m trying to write a book about the relation between economic statistics and neoclassical econ. It’s not going fast: how do you explain to non econ’s why when people like Robert Lucas or Edward Prescott (both Nobel prize winners) write ‘leisure’ they actually mean what you and I call ‘unemployment’…. Anyway, to convince such people that ‘involuntary unemployment’ exist, I was writing a little about the hoboes of the Great Depression. These should be classified as ‘part time workers for economic reasons’ (the statistical framing). Or as an exploited, subsidized reserve army of labor, subsidized as next to working they also had to beg for a living and were free riding and ‘free lodging’ trains. This enabled employers to pay lower wages while this also enabled the households they came from to accept lower wages as there was one mouth less to feed (the Marxist framing). Or, taking into consideration that leaving your family and risking you life for a job (it was a highly dangerous life style) is no fun, they can be seen as ‘part time involuntary unemployed for economic reasons’ (the Keynesian framing). But they do not fit the ‘there is no unemployment’ neoclassical framing of Robert and Edward. Look here for a great website with hobo letters and hobo oral history documents.
While investigating the hoboes and the concept of ‘part time workers for economic reasons’ I discovered a somewhat unknown aspect of the USA unemployment statistics. In January 1994 the Bureau of Labor Statistics changed the questionnaire a little (just some clarifications…) which meant that the amount of ‘part time workers for economic reasons’ suddenly dropped with about 1% of the labor force. Look here for a BLS comment on this. Aside: “Fred” knows this as its series starts in 1955 but it does not allow you to make the graph above but only a graph with data on ‘part time workers’ starting in 1994.
How to deal with this? When making historical comparisons, either decrease the pre 1994 data with about 0,8% during and 0,4 % during booms or increase the present data with the same percentages. I both cases, broad unemployment as defined here is relatively higher compared with the pre-1994 period. Also, as I see it, broad unemployment defined as headline unemployment plus part-time workers for economic reasons is the better metric to use to calculate any kind of Phillips curve (but note that part time for economic reasons has, according to the BLS, a slightly different cyclical behaviour (more leading) than headline unemployment). Take care when analysing the ‘1994’ period.
Hey, any students out there? The hobo documents in combination with the concept of involuntary unemployment are a GREAT subject for a thesis!
Technical addendum: the BLS does not publish the data shown above as a separate series. BLS U-6 unemployment does include part-time workers but also people seeking but not immediately available as well as people available but not seeking. As these last two categories are not very cyclically sensitive, I left them out of this particular estimate of broad involuntary unemployment.