From C. P. Chandrasekhar and Jayati Ghosh Everyone seems to have woken up to the fact that global debt levels are too high and portent difficulties ahead. As Figure 1 indicates, the levels of credit to GDP, which were so high as to be unsustainable and resulted in the big crisis of 2008, have increased even more since then. There was a phase of deleveraging in the advanced economies until around 2014, and in developing countries and emerging markets until 2011, but since then, credit/debt has been expanding again. So much so that the credit GDP levels in 2017 were 15 per cent higher than in 2008 in the advanced economies, and more than 80 per cent higher for emerging markets (Figure 1). Figure 1: Since the GFC, credit to GDP ratios have increased significantly in both advanced
Topics:
Editor considers the following as important: Uncategorized
This could be interesting, too:
tom writes The Ukraine war and Europe’s deepening march of folly
Stavros Mavroudeas writes CfP of Marxist Macroeconomic Modelling workgroup – 18th WAPE Forum, Istanbul August 6-8, 2025
Lars Pålsson Syll writes The pretence-of-knowledge syndrome
Dean Baker writes Crypto and Donald Trump’s strategic baseball card reserve
from C. P. Chandrasekhar and Jayati Ghosh
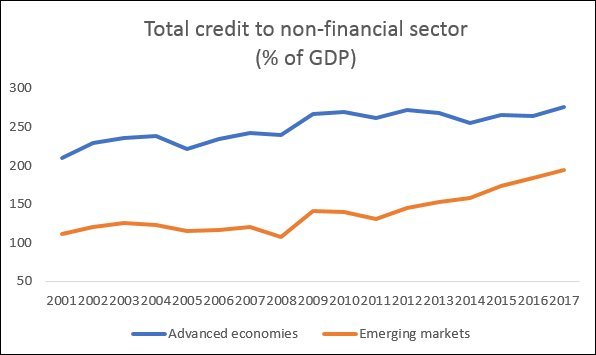
Everyone seems to have woken up to the fact that global debt levels are too high and portent difficulties ahead. As Figure 1 indicates, the levels of credit to GDP, which were so high as to be unsustainable and resulted in the big crisis of 2008, have increased even more since then. There was a phase of deleveraging in the advanced economies until around 2014, and in developing countries and emerging markets until 2011, but since then, credit/debt has been expanding again. So much so that the credit GDP levels in 2017 were 15 per cent higher than in 2008 in the advanced economies, and more than 80 per cent higher for emerging markets (Figure 1).
Figure 1: Since the GFC, credit to GDP ratios have increased significantly in both advanced economies and emerging markets Source for all figures and tables: BIS online database
More recently, the attention has shifted from bank lending to shadow banking activities, which are by those institutions that do not collect deposits but still provide loans. These include a variety of institutions, ranging from trusts, investment funds and similar corporations to kerb lenders. Because they do not come under the regulatory framework for banks, yet tend to be interlinked with them in various ways, there are concerns that overlending and default in such institutions can destabilise the financial system.
Ever since the IL&FS crisis broke in India, there has been much discussion of the fragilities posed by non-bank lending and the potential for financial and economic crises in emerging markets that could be led by the collapse shadow banks. This is in no small measure due to the significant role played by such shadow lending in the core capitalist countries (especially the US) in the build-up to the Great Financial Crisis in 2008.
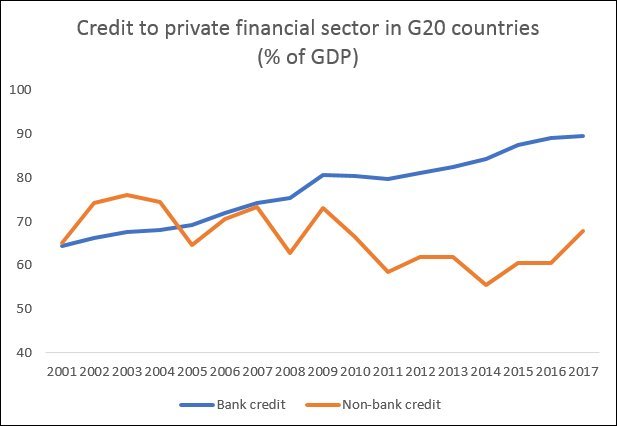
However, since then, shadow lending appears to have reduced, or at least been contained relative to GDP, as indicated by Figure 2. For the G20 countries taken as a group, credit from non-banks as a per cent of GDP was about 6 percentage points lower in 2017 than in 2007, while bank credit had actually increased by 15 percentage points. This suggests that excessive debt creation is much more a problem of the banking sector as a whole than the non-bank or shadow bank sector.
Figure 2: Shadow lending has actually reduced in G20 countries since the Global Crisis

However, it is also increasingly suggested that the problem of shadow banking has become more significant in emerging markets rather than in advanced economies, and that the dramatic increase in such loans in these economies is what will be associated with the next big systemic rick to global finance. In particular, it is suggested that the rapid increase of shadow banking in Asia, especially China, points to the likely area of greatest future concern.
Table 1 provides data for some important advanced and emerging economies to assess the extent to which this argument is valid. Significantly, the reliance on shadow banking appears to have reduced significantly in the advanced economies by 2015-17 from what it was during 2008-10, other than in Germany where it seems to have remained at roughly the same level of around 30 per cent. Even the increase in bank credit was confined to Japan and South Korea, rather than the US, UK or Germany, where it has fallen relative to the levels of 2008-10.
For emerging markets, the picture is more varied. It is certainly true that, compared to 2008-10, the credit extended by shadow banks in China increased sharply by 35 percentage points to nearly 52 per cent of GDP, which is clearly cause for concern. However, bank credit in China over the same period rose even more, to 155 per cent of GDP, an increase of 37 percentage points. What is more, the fact that Chinese banks have become increasingly integrated to the shadow banks through their own investments makes it difficult to view these two separately. Recent moves by the Chinese authorities point to growing regulation of the activities of shadow banks, both internally and in cross-border transactions. So while interest rates and other variables such as maturities in shadow lending may not be subject to the same regulatory regime as for banks, there are clearly attempts to rein them in.
Table 1: Credit to private non-financial sector
(% of GDP, three-year averages)
| Bank credit | Non bank credit | |||||
| Countries | 2001-03 | 2008-10 | 2015-17 | 2001-03 | 2008-10 | 2015-17 |
| Advanced economies | ||||||
| US | 48.9 | 54.8 | 51.5 | 93.6 | 110.0 | 98.7 |
| UK | 87.3 | 102.9 | 88.3 | 69.1 | 89.2 | 78.9 |
| Germany | 100.4 | 87.9 | 76.0 | 29.5 | 29.1 | 30.2 |
| Japan | 104.0 | 103.4 | 107.3 | 76.6 | 63.8 | 48.1 |
| South Korea | 104.1 | 130.4 | 131.1 | 43.2 | 47.5 | 61.4 |
| Emerging markets | ||||||
| China | 115.4 | 118.1 | 155.3 | 1.2 | 17.0 | 51.7 |
| Russia | 17.9 | 39.5 | 52.6 | 9.4 | 15.5 | 16.1 |
| Brazil | 53.0 | 61.3 | 72.3 | 37.5 | 66.7 | 69.4 |
| India | 34.1 | 53.6 | 54.1 | 1.4 | 4.0 | 3.4 |
| Argentina | 13.8 | 12.3 | 14.5 | 28.4 | 7.2 | 4.7 |
| Malaysia | 135.5 | 113.3 | 132.5 | 2.1 | 3.8 | 4.7 |
| Indonesia | 18.7 | 25.2 | 35.1 | 6.5 | 1.5 | 5.1 |
Other developing countries do not show such a dramatic increase. Shadow lenders in Brazil did increase their credit to a significant 69 per cent of GDP, but this was less than a 3 percentage point increase in 2015-17 compared to 2008-10, while bank credit increased by 11 percentage points. In the other countries described here, shadow lending remained minor and even fell relative to GDP. Of course, it should be noted that this indicator (of non-bank credit) captures only one identifiable indicator of shadow banking trends, and there may be institutions not captured in national statistical compilations that conceal additional elements of shadow banking, as well as other investments made by such financial companies.
The most surprising (in view of the noise around shadow lending in the wake of the IL&FS failure) is the very low spread of credit from non-banks in India (only 3.4 per cent of GDP in 2015-17, even lower than the 4.3 per cent recorded in 2008-10). The surprising thing in India seems to be not the rapid expansion of credit – because it has been relatively low by international standards – but the fact that even with relatively low credit disbursal, so much of the lending has turned non-performing, and the extent of actual or possible default has been enough to suppress both bank and non-bank lending in the recent past. This speaks of considerable mismanagement of the financial sector, which has managed to get into a mess even without expanding all that much overall.
(This article was originally published in the Business Line on December 4, 2018)
