The next post is interesting on different levels. First, interest rates are low and it shows that medium run changes in these rates can to quite some extent be ‘explained’ by a cocktail of: economic variables, price setting by central banks and expectation variables (mind that the model is straightforward but the variables aren’t!). This, however, does not explain why USA rates are quite a bit higher than (in this case) German rates, even when inflation, growth and unemployment in the USA and Germany is not too different. Second, it’s an example of investigating Keynes’ ‘beauty contest‘ (what do others expect expectations to be) and Soros’ ‘reflexivity‘ (expectations may be dead wrong but do influence markets so people follow them as they are paid to make short term gains) as well as
Topics:
Merijn T. Knibbe considers the following as important: Uncategorized
This could be interesting, too:
tom writes The Ukraine war and Europe’s deepening march of folly
Stavros Mavroudeas writes CfP of Marxist Macroeconomic Modelling workgroup – 18th WAPE Forum, Istanbul August 6-8, 2025
Lars Pålsson Syll writes The pretence-of-knowledge syndrome
Dean Baker writes Crypto and Donald Trump’s strategic baseball card reserve
The next post is interesting on different levels. First, interest rates are low and it shows that medium run changes in these rates can to quite some extent be ‘explained’ by a cocktail of: economic variables, price setting by central banks and expectation variables (mind that the model is straightforward but the variables aren’t!). This, however, does not explain why USA rates are quite a bit higher than (in this case) German rates, even when inflation, growth and unemployment in the USA and Germany is not too different. Second, it’s an example of investigating Keynes’ ‘beauty contest‘ (what do others expect expectations to be) and Soros’ ‘reflexivity‘ (expectations may be dead wrong but do influence markets so people follow them as they are paid to make short term gains) as well as possibly a weak version of the rational financial markets idea (whenever ideas like this become common knowledge you can’t exploit them anymore). Third, rates like these are used to set interest rates used to discount future pension liabilities of pension funds. These liabilities stretch six to seven decades into the future. The model shows that todays’ low rates, which lead to a quite high calculated present value of future liabilities and hence to less favorable calculated funding of pensions, are partly driven by short term upswings and downswings of the business cycle. Millions of people risk having lower pensions now or in ten or twenty years time because we’re now in a downswing, or at least we expect to be in a downswing. That sure is an example of reflexivity – and of a kind we do not need.
Introducing a new “fair value” model for bond yields.
The last fortnight has been dominated by Brexit headlines, a very volatile and uncontrollable topic, making it difficult to come up with views / ideas. We put this time to use by developing a “fair value” model for rates which we introduce here.
The question and the model
Often times we hear things like “Bunds are too expensive”, or “overcooked” or that they need to “normalize”. But what is “fair” or “normal”? We feel Bund yields are a simple function of macro conditions and in fact track said macro conditions quite closely. So we ran a simple regression with 5 factors:
- One economic variable representing global macro conditions
- One economic variable representing Eurozone macro conditions
- One market variable representing policy rate and its expected medium term trajectory
- One market variable representing inflation expectations
- One market variable representing risk-on / risk-off
All pretty simple stuff, accessible freely to any Bloomberg subscriber, regressed with Excel.
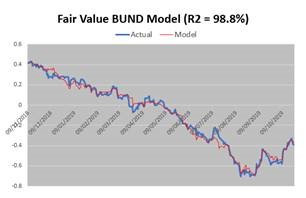
Does it fit? In spite of its simplicity, the model tracks the actual 10yr Bund yield very closely, with an impressive 98.8% R2:
(Source: HPC using Bloomberg data)
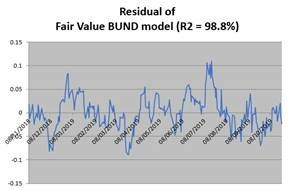
Conclusion: Yields do seem to be a pure function of a simple set of macro data, and do not seem to veer very far from “fair value”, with residuals rarely outside of a -5 bps / +5 bps range.
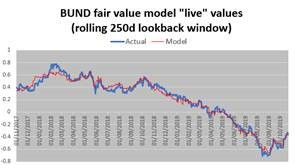
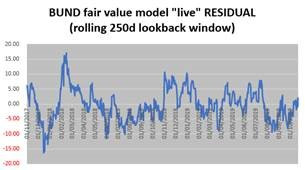
Does it work in practice? Obviously any regression benefits from hindsight so it would be interesting to look at the “live” outputs over time, i.e. what are the model’s value and residual at any point in time with the contemporary model (regressed over a rolling 250 days window). We looked at this output over the last two years:
(Source: HPC using Bloomberg data)
As expected the “live” output tracks actual yields less closely, but on the whole this remains a decent fit. The average “live” residual is a mere -0.26 bps, i.e. pretty much zero.
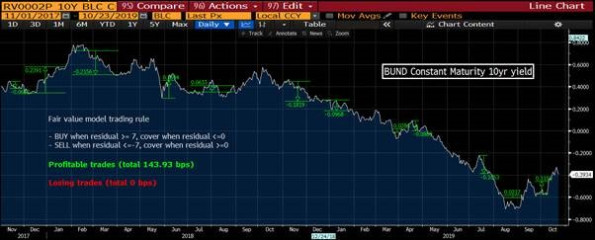
Is it any use? Is it any use to know if Bunds are a few basis points rich or cheap versus a “fair value” model? The ultimate acid-test is to see what happens if one buys when it is very cheap / sell when it is very expensive by that measure and see what happens. So we tested on the same period the simple trading rule. We wanted a simple rule that avoided “over fitting”. November 18 to date, the 95th and 5th percentiles of the live residual were respectively 7.48 bps and -7.09 bps so we chose 7 bps as a simple, reasonable, round number we could use and then applied it to the full sample. As it happens, this simple (even simplistic) rule would have had astonishingly good results, with not a single losing trade over the period. So:
BUY when “live” residual >= 7 bps (*), cover when residual <= 0
SELL when “live” residual <= -7 bps (*), cover when residual >= 0
(Source: Bloomberg)
For a total +143.93 bps profit and a mere -10.47 bps max drawdown. Importantly, the rule worked equally well in a trendless period (Nov 17- Oct 18 : +74.31 bps, max drawdown -5.27 bps) as in a trending one (Nov 18 – Oct 19: +69.62 bps, max drawdown -10.44 bps). So we can safely conclude this model is useful in practice and in the future we will flag to our clients when it signals extreme valuations one way or the other.
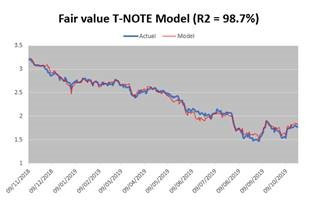
Can it be expanded? As this worked so well for Bund yields, the approach can be applied to other yields. We tried for T-NOTES (same 1 & 5 inputs, USD equivalent inputs for 2, 3 & 4) and also got good results with a similar R2.
(Source: HPC using Bloomberg data)
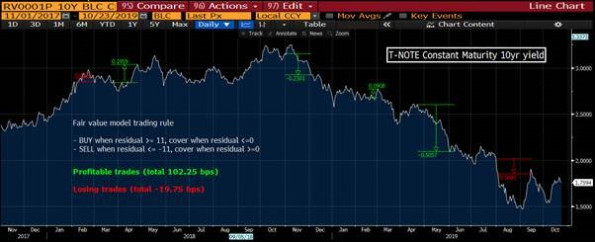
Although here t-notes look less “mean reverting” than Bunds and tend to stay further for longer from “fair value”. The methodology seems to remain valid though. Putting it to the same “trading rule” test, we find that albeit less sharp, the result remains positive.
(Source: Bloomberg)
This opens additional questions: can this be applied to yet more markets, maybe Gilts?
- We will try.
Can this be used in combination, to trade cross-currency or to combine values for greater signal quality?
-
We tried a few possibilities but with poor results. So far the best use seems to be the simplest, as described above.

