The Federal Reserve (Fed) publishes the Flow of Funds. It has recently made an important addition to these invaluable financial data: quarterly distributional financial accounts. They are more frequent, more detailed and much faster than existing accounts. Why did they do this? For one thing: distributional accounts are not a new idea. As stated in their first footnote (but note the gap between the fifties and 2014): For example, Carroll (2014) cites the need for distributional national statistics, while the Inter-Agency Group on Economic and Financial Statistics has called on G-20 nations to develop such statistics that are internationally comparable. Other efforts to construct distributional national measures in the United States include early work by King (1915), King (1927), King
Topics:
Merijn T. Knibbe considers the following as important: Uncategorized
This could be interesting, too:
tom writes The Ukraine war and Europe’s deepening march of folly
Stavros Mavroudeas writes CfP of Marxist Macroeconomic Modelling workgroup – 18th WAPE Forum, Istanbul August 6-8, 2025
Lars Pålsson Syll writes The pretence-of-knowledge syndrome
Dean Baker writes Crypto and Donald Trump’s strategic baseball card reserve

The Federal Reserve (Fed) publishes the Flow of Funds. It has recently made an important addition to these invaluable financial data: quarterly distributional financial accounts. They are more frequent, more detailed and much faster than existing accounts. Why did they do this? For one thing: distributional accounts are not a new idea. As stated in their first footnote (but note the gap between the fifties and 2014):
For example, Carroll (2014) cites the need for distributional national statistics, while the Inter-Agency Group on Economic and Financial Statistics has called on G-20 nations to develop such statistics that are internationally comparable. Other efforts to construct distributional national measures in the United States include early work by King (1915), King (1927), King et al. (1930), Kuznets (1947), and Kuznets and Jenks (1953), more recent efforts by Piketty et al. (2017), and official measures currently in development at the Bureau of Economic Analysis (e.g., Furlong (2014), Fixler and Johnson (2014), Fixler et al. (2017)).
Outside of the USA, Keynes introduced with ‘How to pay for the war‘ distributional accounts into national accounts based policy analysis. And that’s why we still need them, as the report states:
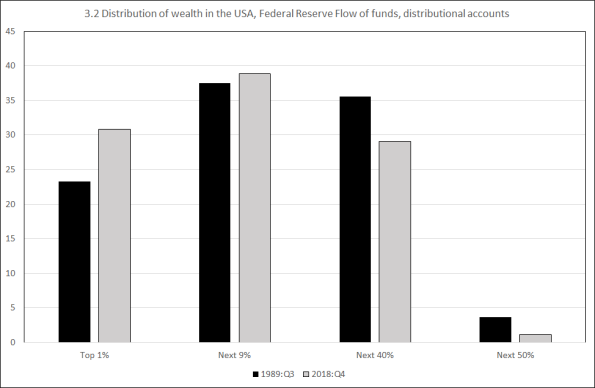
Wealth concentration is an important characteristic of the United States economy, with evidence mounting that concentration has increased over the last 30 years (Wolff et al. (2012), Piketty (2013), Bricker et al. (2016), Saez and Zucman (2016), Rios-Rull and Kuhn (2016)). This increase in concentration has important implications for a number of economic and social outcomes. For instance, studies have examined the relationship between the wealth distribution and economic growth (Banerjee and Duflo (2003)), monetary policy transmission (Auclert (2019), Gornemann et al. (2016), Kaplan et al. (2018)), aggregate saving rates (Fagereng et al. (2016)), optimal tax policy (Albanesi (2011), Shourideh (2012)), social mobility (Benhabib et al. (2017)), and even political engagement (Solt (2008)). The explosion of interest in the wealth distribution has also highlighted several limitations of some of the existing data sources. For example, many of the existing measures of the household wealth distribution are not comprehensive in their concept of household wealth, are measured at a relatively low frequency, or are only available with a substantial lag. Separately, scholars who focus on national accounts have expressed interest in incorporating microeconomic heterogeneity into these frameworks
The graph above compares the new DFA data with existing World Income Database data on the USA. As can be seen, they indeed are faster, show (due to a more comprehensive measure of wealth) slightly slower inequality and a somewhat more plausible increase during recent decades. And: does lower unemployment indeed lead to somewhat lower income inequality, as the very last part of the graph suggests?
Two graphs I made:


The elephant in the room is of course the decline of wealth of the bottom 90% of the USA population. Despite Tinbergen’s best efforts, income distribution wasn’t considered a very worthwhile branch of economics for quite some time. It’s good that this has changed. The Fed has done a great job.
