Two days ago I posted ‘The macro economic graph of the decade‘. The comments were highly interesting and may be summarized as: “what does ‘headline’ unemployment measure anyway”. About this: Headline of ‘U-3’ unemployment only captures a part of labor slack and is designed to capture only part of total slack. It can however be supplemented with other unemployment measurements which are designed to measure additional slack, like underemployed workers or discouraged workers. But there are reasons to assume that it systematically underestimates what it tries to measure. Ad 1) USA ‘broad’ unemployment is, measured in persons, at this moment about twice as high as headline unemployment (graph, I use USA data as these are very easily available). Also, the difference between broad and
Topics:
Merijn T. Knibbe considers the following as important: Uncategorized
This could be interesting, too:
tom writes The Ukraine war and Europe’s deepening march of folly
Stavros Mavroudeas writes CfP of Marxist Macroeconomic Modelling workgroup – 18th WAPE Forum, Istanbul August 6-8, 2025
Lars Pålsson Syll writes The pretence-of-knowledge syndrome
Dean Baker writes Crypto and Donald Trump’s strategic baseball card reserve
Two days ago I posted ‘The macro economic graph of the decade‘. The comments were highly interesting and may be summarized as: “what does ‘headline’ unemployment measure anyway”. About this:
- Headline of ‘U-3’ unemployment only captures a part of labor slack and is designed to capture only part of total slack. It can however be supplemented with other unemployment measurements which are designed to measure additional slack, like underemployed workers or discouraged workers.
- But there are reasons to assume that it systematically underestimates what it tries to measure.
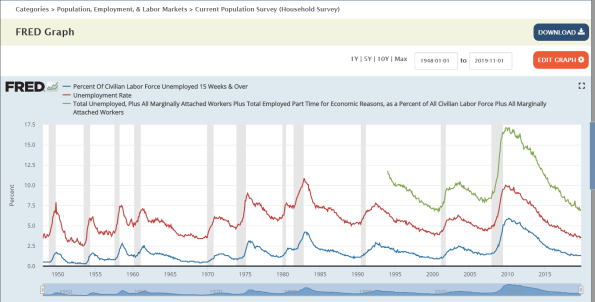
Ad 1) USA ‘broad’ unemployment is, measured in persons, at this moment about twice as high as headline unemployment (graph, I use USA data as these are very easily available). Also, the difference between broad and headline unemployment decreased with about 3% since 2009, or about as much as the increase of the USA labor force participation rate. As discouraged and marginally attached workers are not considered to be part of the labor force but are included in broad unemployment, and as part of these might have entered the official labor force, broad unemployment seems to be a better metric of labor slack than headline unemployment. Even when headline unemployment still is a very good cyclical indicator broad unemployment is to an extent the cycle. Mind that it is measured in people and the individuals experiencing unemployment and not in hours. The employment part of the economic cycle as we measure it is, in the end, more about people than about hours even when hours are not unimportant, too. To quote the comment of Ken Zimmerman:
People do not simply recover; their worlds do not just return to normal. But the ways in which their worlds change, and the ways in which they remain the same, vary dramatically across contexts. Juxtaposing ethnographic accounts of unemployment across a variety of regions, professions, and populations also allows us to identify common themes and experiences without reducing the significance of the intersection of gender, class, age, race, and citizenship in specific cultural contexts. All of which economic theory ignores and of which much economic research is unaware. The graph is just a line on a page. Contextual studies help us figure out what’s happening that leads to that graph, and many others.
Mind that, according to the official definitions, the workers in the vineyard as well a youngster without work and editing his or her LinkedIn profile are considered ‘unemployed’.
Ad 2) The concept of unemployment has, over time, been hotly debated. In my view the discussion about ‘involuntary unemployment’ even gave rise to Keynesian as well as neoclassical macro economics (Keynes invented the concept, neoclassical macro bent over backwards trying to disprove it). As a result of these often highly political discussions (guided by the ILO) somebody who works for even one hour is not ‘headline unemployed’, to counter criticisms that some of the unemployed still have some work. And also, importantly, because unemployment data are based on surveys. And a survey question about having any paid work or no paid work at all is easier to answer than a survey question if you worked twelve or thirteen hours in a specific week. But even when the survey is large and even when the same persons are asked different times about their situation to be able to track a little piece of their life history survey bias is unavoidable. Which, according to Hie Joo Ahn and James Hamilton means that measured headline unemployment might understate real unemployment:
The underlying data from which the U.S. unemployment rate, labor-force participation rate, and duration of unemployment are calculated contain numerous internal contradictions…. We find that the usual statistics understate the unemployment rate and the labor-force participation rate by about two percentage points on average and that the bias in the latter has increased since the
Great Recession. The BLS estimate of the average duration of unemployment overstates by 50% the true duration of uninterrupted spells of unemployment and misrepresents what happened to average durations during the Great Recession and its recovery
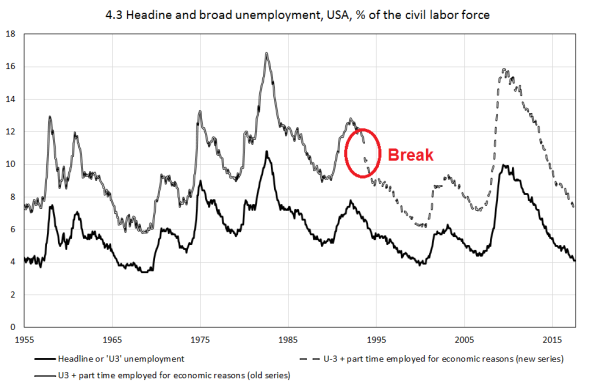
See also the second graph (which only counts underemployed part time workers as ‘broadly unemployed!). It shows a decline of ‘broad’ unemployment of about 1% due to a slightly different wording of one of the questions in the survey. Economic measurement is quite a challenge. Returning to the comments of Trond Andresen and rogerlewis: real unemployment is always and everywhere higher than headline unemployment. And it is about the experience of individual people. Not just about hours.