From David Ruccio The idea that GDP numbers don’t tell us a great deal about what is really going on in the world is becoming increasingly widespread. David Leonhardt, in reflecting the emerging view, has argued that GDP doesn’t “track the well-being of most Americans.” Now, we’d expect that someone like socialist Democratic candidate Bernie Sanders would question the extent to which the low unemployment numbers, associated with economic growth, hardly tells the whole story about the condition of the American working-class. Unemployment is low but wages are terribly low in this country. And many people are struggling to get the health care they need to take care of their basic needs. But even centrist candidates Joe Biden and Pete Buttigieg are making the case that the headline
Topics:
David F. Ruccio considers the following as important: Uncategorized
This could be interesting, too:
tom writes The Ukraine war and Europe’s deepening march of folly
Stavros Mavroudeas writes CfP of Marxist Macroeconomic Modelling workgroup – 18th WAPE Forum, Istanbul August 6-8, 2025
Lars Pålsson Syll writes The pretence-of-knowledge syndrome
Dean Baker writes Crypto and Donald Trump’s strategic baseball card reserve
from David Ruccio
The idea that GDP numbers don’t tell us a great deal about what is really going on in the world is becoming increasingly widespread.
David Leonhardt, in reflecting the emerging view, has argued that GDP doesn’t “track the well-being of most Americans.”
Now, we’d expect that someone like socialist Democratic candidate Bernie Sanders would question the extent to which the low unemployment numbers, associated with economic growth, hardly tells the whole story about the condition of the American working-class.
Unemployment is low but wages are terribly low in this country. And many people are struggling to get the health care they need to take care of their basic needs.
But even centrist candidates Joe Biden and Pete Buttigieg are making the case that the headline numbers, such as Gross Domestic Product and stock indices, hide the fact “that a very different reality exists for many Americans who have not seen much improvement in their own bottom lines.”
And one of the last people you’d expect to question the shared gains from economic growth, Robert Samuelson, thinks that “something momentous is clearly occurring.”
economic inequality continues to rise at a steady pace; the further you go up the income scale, the larger the income gains, both relatively and absolutely. . .
The great danger here is social and political. It is the creation, or the expansion, of a multi-tiered society where the largest income gains are enjoyed by relatively small groups of people near the top of the economic distribution.
So, let’s step back a bit and see what these numbers reveal—and what they mostly hide.
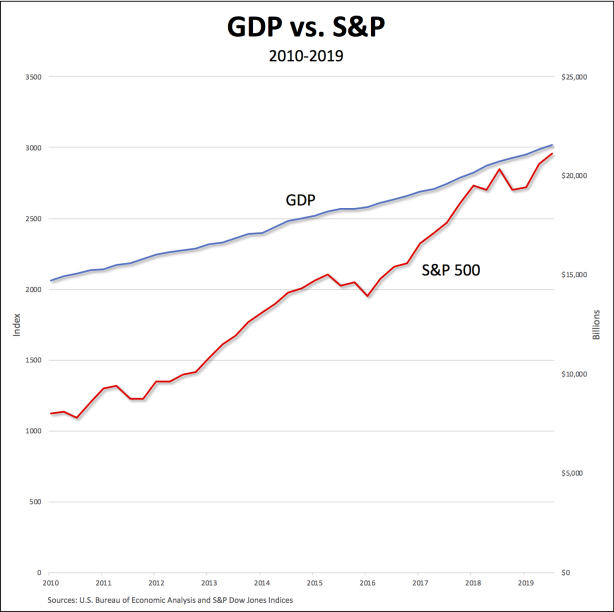
First, as is clear from the chart immediately above, the growth in the value of U.S. stock markets (as measured by the S&P 500 Index, the red line) doesn’t tell us much about actual economic growth (as indicated by the value of Gross Domestic Product, the blue line). For example, between 2010 and 2019, the stock market increased by 163 percent, while GDP grew by only 46 percent.
Second, neither number alone indicates what is happening to the vast majority of Americans. For example, as I argued back in 2017, ownership of stocks in the United States is grotesquely unequal: while about half of U.S. households hold stocks in publicly traded companies (directly or indirectly), the bottom 90 percent of U.S. households own only 18.6 percent of all corporate stock. The rest (81.4 percent) is in the hands of the top 10 percent.
Well, then, what about GDP?
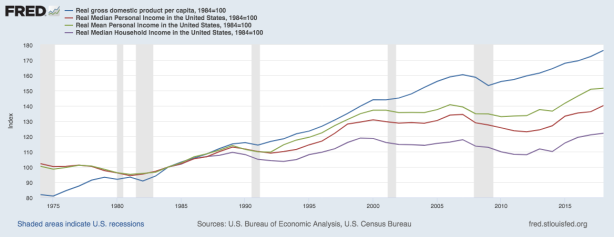
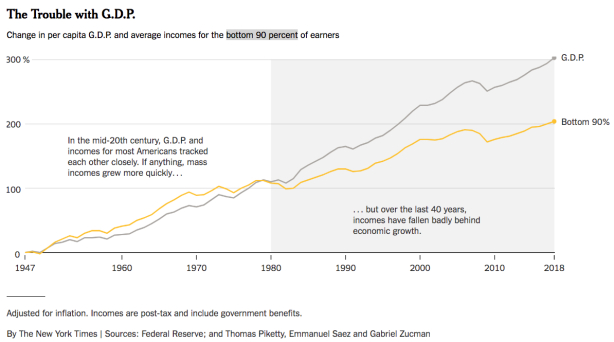
It’s obvious from this chart that the increases in all the indicators of average income in the United States—real median personal income (the red line), real mean personal income (green), and real median household income (purple)—are much lower than the increase in real (inflation-adjusted) GDP. Those discrepancies reveal the fact that the average person or household is benefiting much less than they otherwise would from economic growth. And, of course, the gap increases over time, as in every year people fall further and further behind.
So, all that the GDP numbers indicate is that the monetary value of final goods and services produced and sold in the United States—the “immense accumulation of commodities” that represents the wealth of a capitalist society—is growing. But it doesn’t tell us anything about who gets what, that is, how the incomes generated during the course of producing those commodities are distributed. In other words, GDP numbers are a poor indicator of people’s well-being.
So, what would tell us something about how Americans are faring in the midst of the so-called recovery from the Second Great Depression?
Leonhardt’s view is that “distributional accounts”—that is, estimates of income shares for every decile of the income distribution, as well as for the top 1 percent—will change the national discussion whenever GDP numbers are released.
I don’t know if they’ll change the terms of debate but they will certainly challenge the presumption that GDP (and other headline numbers, such as stock market indices) accurately the economic and social health of the nation.
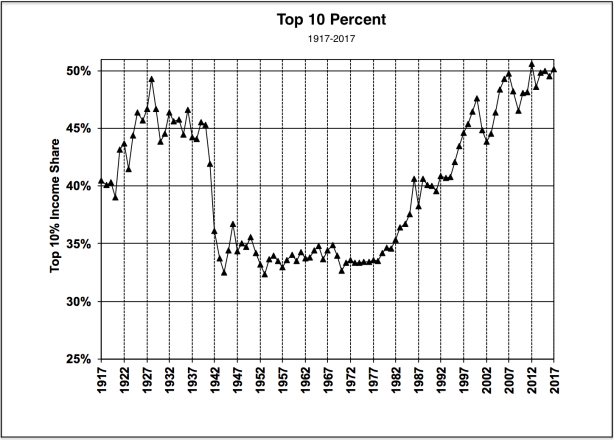
Thus, for example, as Emmanuel Saez (pdf) has shown, by 2017, real incomes of the bottom 99 percent had still not recovered from the losses experienced during the initial years of the Second Great Depression (from 2007 to 2009), while families in the top 1 percent families captured almost half (49 percent) of total real income growth per family from 2009 to 2017. And, as a result of growing inequality, the 50.6 percent top 10 percent income share in 2017 (with capital gains) is virtually as high as the absolute peak of 50.6 percent reached in 2012.

Moreover, according to the Congressional Budget Office (pdf), income before transfers and taxes is projected to be more unequally distributed in 2021 than it was in 2016. And while means-tested transfers and federal taxes serve to reduce income inequality, the reduction in inequality stemming from transfers and taxes is actually projected to be smaller in 2021 than it was in 2016.
All of these distributional effects of the current mode of production in the United States are hidden from view by the usual headline economic numbers.
But there’s one more step that can and should be taken. The distributional accounts that have been used to change the discussion focus on the size distribution of income, that is, the distribution of income to groups of individuals (and individual households) that make up the population. What is missing, then, is the factor or class distribution of income.
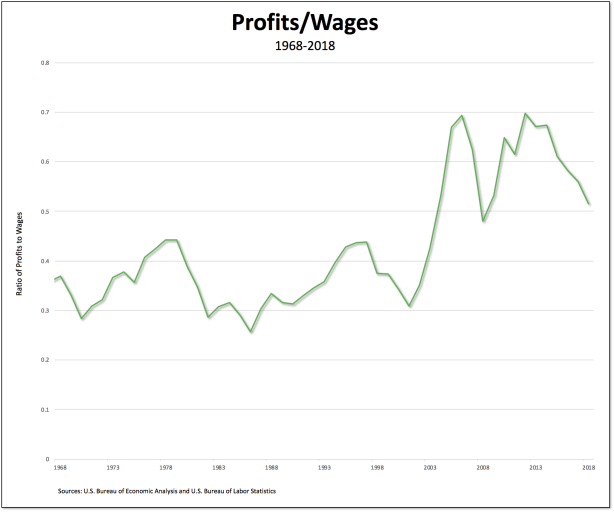
In the chart above, I have illustrated the changing ratio of corporate profits to workers’ wages in the United States from 1968 to 2018.* Two things are remarkable about the trajectory of this ratio. First, beginning in 2001, the ratio more than doubled, from a low of 0.31 to a high of 0.70 (in 2006). And, second, even though the ratio has fallen in recent years, it still remains as of 2018 much higher (at 0.52) than during the pre-2001 period.**
However inequality is measured—in terms of the size or class distribution of income—it is obvious that most Americans are not sharing in the growth of national income (or, for that matter, the stock-market gains) in recent years.
The focus on GDP (and stock indices, unemployment rates, and the like) serves merely to hide from view what the American workers clearly understand: they’re being left behind.
*This is the ratio of, in the numerator, corporate profits before tax (without IVA and CCAdj) and, in the denominator, the total wages paid to production and nonsupervisory workers (assuming a work year of 50 weeks). It is clearly similar to but different from the Marxian rate of exploitation, surplus-value divided by the value of labor power—since, among things, it does not include distributions of the surplus to members of the top 10 percent in the numerator.
**A third observation is also relevant: the ratio of profits to wages has fallen prior to every recession since 1968. The recent decline in the ratio (since 2013) therefore portends another recession in the near future. However, I’m no more keen on making predictions than on coming up with New Year’s resolutions. It was John Kenneth Galbraith who wisely wrote, “There are two kinds of forecasters: those who don’t know, and those who don’t know they don’t know.”