Summary:
Source: International Monetary Fund. “As the chart shows, China’s economy first passed the U.S. in 2017. It is projected to be more than 16 percent larger this year, and by 2025 is projected to be almost 40 percent larger by 2025.” Dean Baker
Topics:
Editor considers the following as important: Uncategorized
This could be interesting, too:
tom writes The Ukraine war and Europe’s deepening march of folly
Stavros Mavroudeas writes CfP of Marxist Macroeconomic Modelling workgroup – 18th WAPE Forum, Istanbul August 6-8, 2025
Lars Pålsson Syll writes The pretence-of-knowledge syndrome
Dean Baker writes Crypto and Donald Trump’s strategic baseball card reserve
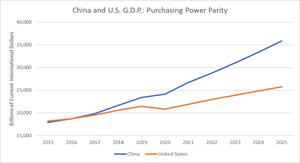
Source: International Monetary Fund.
“As the chart shows, China’s economy first passed the U.S. in 2017. It is projected to be more than 16 percent larger this year, and by 2025 is projected to be almost 40 percent larger by 2025.” Dean Baker