In 2019, the Irish rate of ‘gross fixed capital formation’ (which I hitherto will call fixed investment), was 54,6%. More than half of total national expenditure… This was over twice the rate in most other European countries. And three times the Irish rate in 2011 or the Italian rate in 2014. What happened? Was this real? Were they building three times as many houses and roads, buying three times as many planes and trucks and doing three times as much Research and Development (which is considered to be ‘gross fixed capital formation’) as only a few years before? Nope. But if that wasn’t the case, what was the case? Below, I’ll show the results of an update of my data on long term rates of fixed investments in a number of countries, adding 4 years to the series already published. This
Topics:
Merijn T. Knibbe considers the following as important: Uncategorized
This could be interesting, too:
tom writes The Ukraine war and Europe’s deepening march of folly
Stavros Mavroudeas writes CfP of Marxist Macroeconomic Modelling workgroup – 18th WAPE Forum, Istanbul August 6-8, 2025
Lars Pålsson Syll writes The pretence-of-knowledge syndrome
Dean Baker writes Crypto and Donald Trump’s strategic baseball card reserve
In 2019, the Irish rate of ‘gross fixed capital formation’ (which I hitherto will call fixed investment), was 54,6%. More than half of total national expenditure… This was over twice the rate in most other European countries. And three times the Irish rate in 2011 or the Italian rate in 2014. What happened? Was this real? Were they building three times as many houses and roads, buying three times as many planes and trucks and doing three times as much Research and Development (which is considered to be ‘gross fixed capital formation’) as only a few years before? Nope. But if that wasn’t the case, what was the case? Below, I’ll show the results of an update of my data on long term rates of fixed investments in a number of countries, adding 4 years to the series already published. This update shows (1) a moderate but welcome uptick of the rate of fixed investment in Europe and (2) a big, fat anomaly in (there we go again…) Ireland, which will be discussed. The piece will be laced with remarks about the (changed) concept of fixed investment
.
Fixed investments are crucial for long term prosperity: bridges, hospitals, machines, houses, marinas, new technologies, parks, walkable cities, parking lots covered with solar cells – whatever. Including military equipment. Fixed investments also tend to be fickle: economic events and prices (including the interest rate) tend to have an a large influence on investments. As, over time, fixed investments have become more important as a part of total expenditure, this means that the fickle element of total expenditure has become larger, making our economies prone to endogenous downturns. But: do the concepts used by statisticians to measure fixed investments enable us to analyze the historical rate of investment and its relation to economic development and the business cycle? In a book I published a few years ago I compared the (usually well defined) concepts of the national accounts with the (ill defined) concepts of neoclassical macro. The investments chapter extended investment data in a 1955 publication by Simon Kuznets, ‘International differences in capital formation and financing‘ forward and backward (even when I, unlike Kuznets, did not pay attention to financing). The Irish data will help us to figure out if the concept used at present indeed enable us to analyze the role of ‘gross fixed capital formation – or if the concepts are flawed.
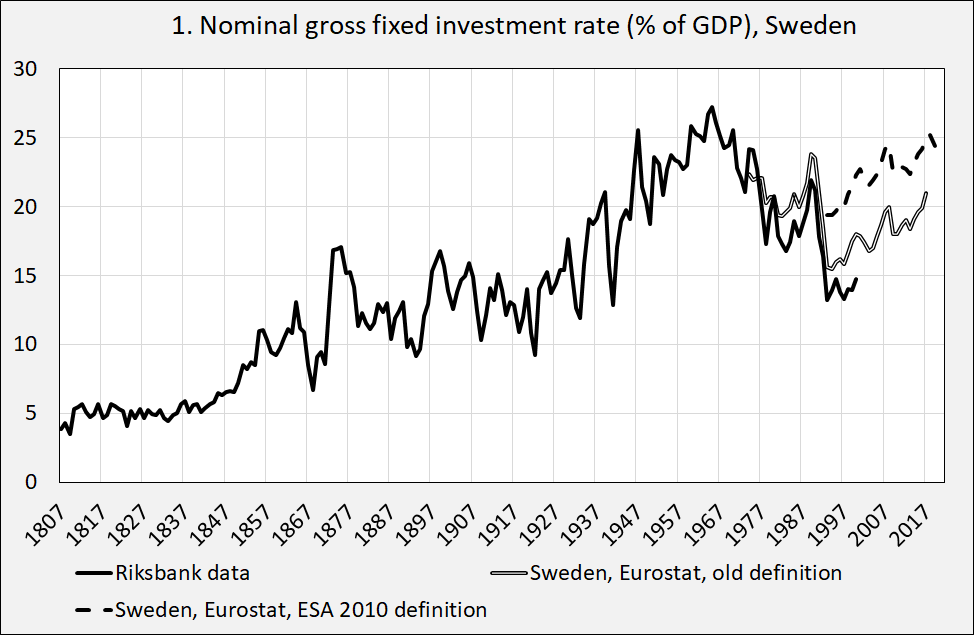
Figure 1 shows the Swedish experience which is quite typical for European countries bar the UK. We do see a close correspondence with broadly defined phases of development. A low level up to around 1850, a bumpy and irregular increase up to around 1950 (the onset of modern economic growth, think railways and harbours), a high level between roughly 1950 and 1973 (the post war years of unprecedented progress, think highways, houses and Swedish malls) and a decline afterwards, even when the update (2018-2021) shows that the rate is on the rise again. Remarkable aspects of the Swedish experience are the very low rate before 1850 (somewhat suspect to me) and the large decline and slow recovery after the Swedish banking crisis of the early nineties (think reckless lending). Remarkable is also the difference between the Riksbank plus the old Eurostat data and the newer data. This difference is caused by a change of concepts. The newer data contain, contrary to the older data, also expenditure on:
- military equipment
- non tangible fixed capital like patents
We’ll return to non tangible fixed capital (Ireland). A hobby horse of me: the high 1950-1973 level was sustainable while a somewhat comparable investment rate around 1990, associated with reckless lending by banks was not sustainable. The ‘stable’ rate of investment seem to be historical contingent.
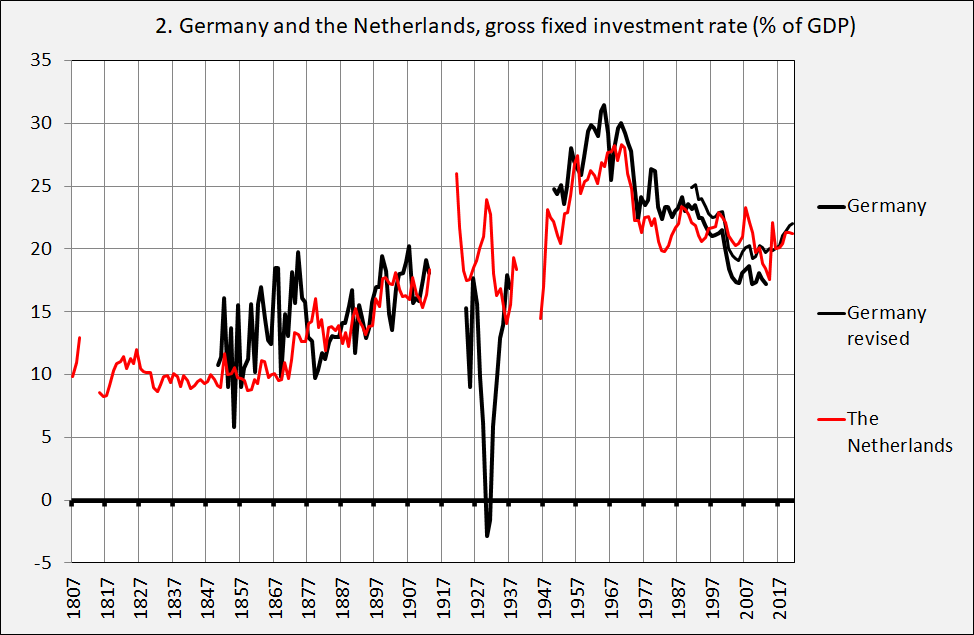
Figure 2 shows data from the Netherlands and Germany which, more or less, repeat the Swedish pattern even when levels before 1850 are higher. The negative rate for Germany is possible: de-investment can and does happen and, in this case, underscores the severity of the Great Depression in Germany. Again, the ‘trentes glorieuses’ between roughly 1950 and 1973 stand out. The data of the last years confirm the idea that the rate of investment is somewhat on the rise again, the differences between the German data based on the old and the new concept of fixed investment are not as large as those for Sweden. The high post World War I level in the Netherlands was possible because of an abundance of capital from the colonies (Indonesia) as well as from war time profits and the possibilities enabled by the disorder in Germany and Belgium..
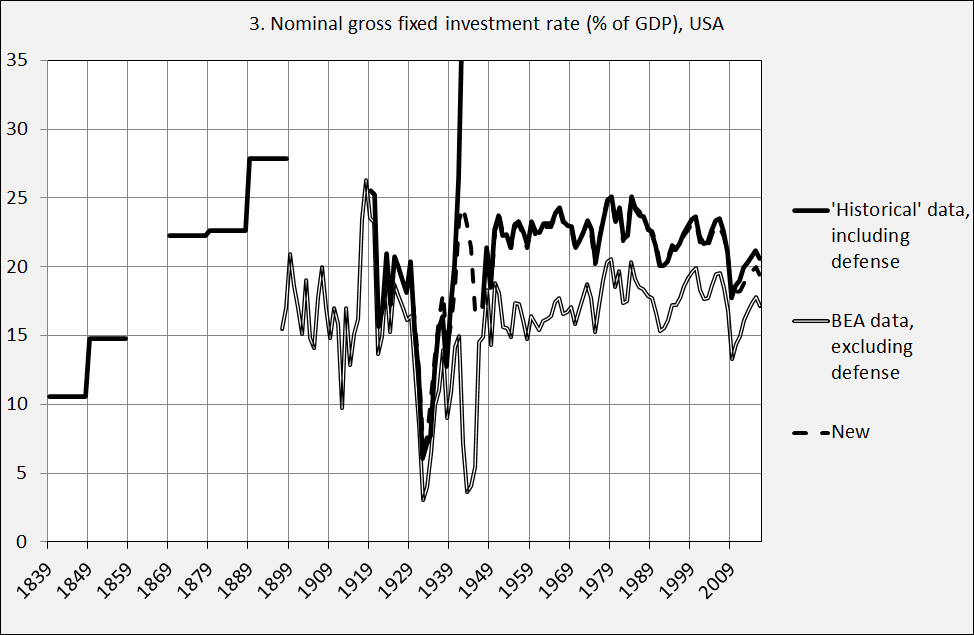
Figure 3 shows USA data. The high level during the nineteenth century stands out, as well as the absence of the bump between 1950 and 1973. For a long time the USA was clearly in the lead and ahead of Europe, at least when it comes to investments. The European upturn during the most recent period is however absent. As we can see, investment in military equipment is considerable. The question can be posed if investment in tanks, rockets, manpads and other military equipment should be rated ‘investments’. As the national accounts define fixed equipment as non-financial items which (among other aspects) enable people to carry value from one period to another there sure are reasons to do this. There is a lively trade in second hand military equipment! The very large downward swing during the Great Depression is extremely important in an analytical sense. There is no way that ‘ordinary’ government spending or ‘ordinary’ consumer spending could fill this 15% of GDP gap! I mean: suppose that government spending in those days was 10% of GDP. Filling a hole of 15% of GDP meant that the government should have more than doubled in size (which of course did happen in WW 2).
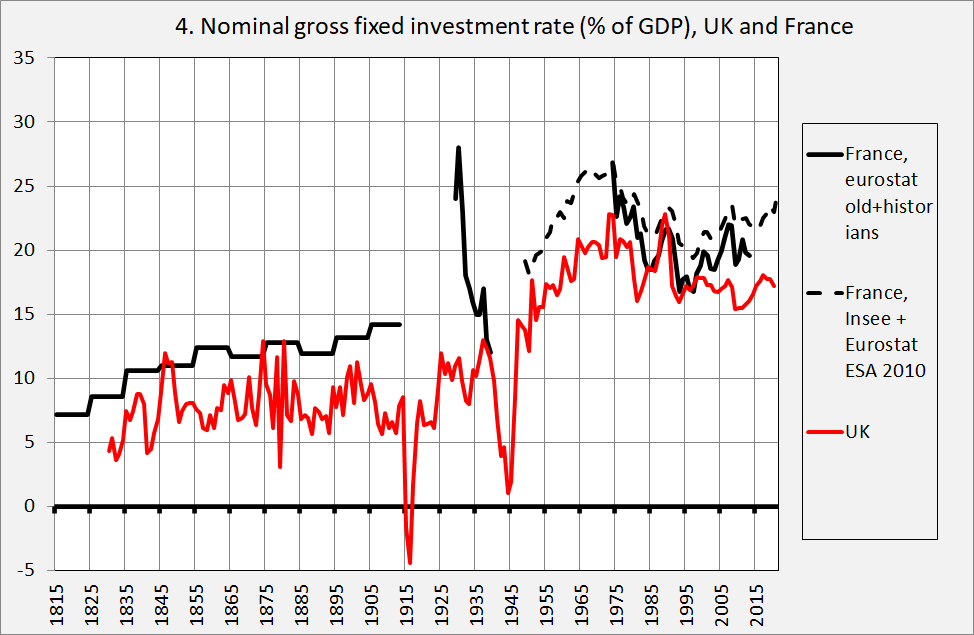
Figure 4 shows the investment rate for France and the UK. France clearly follows the German/Dutch/Swedish pattern. The UK doesn’t. The 19th century UK level is low, just like the twentieth century level. There is a bump after 1950 but it’s not as outspoken as for the other European countries. Remarkably is the high French level of the (end of) the twenties: clearly there were quite some possibilities to invest. To name a few: the new mega sport stadiums, highways and their predecessors, houses for a population which was growing fast and which demanded better quality housing and trucks which were replacing horses and carriages. Mainly the same things which were built during the ‘trentes glorieuses’. The possibilities were available – but the Great Depression and a few years later World War 2 led to an interruption the high level of investment characteristic for middle-twentieth century economic development.
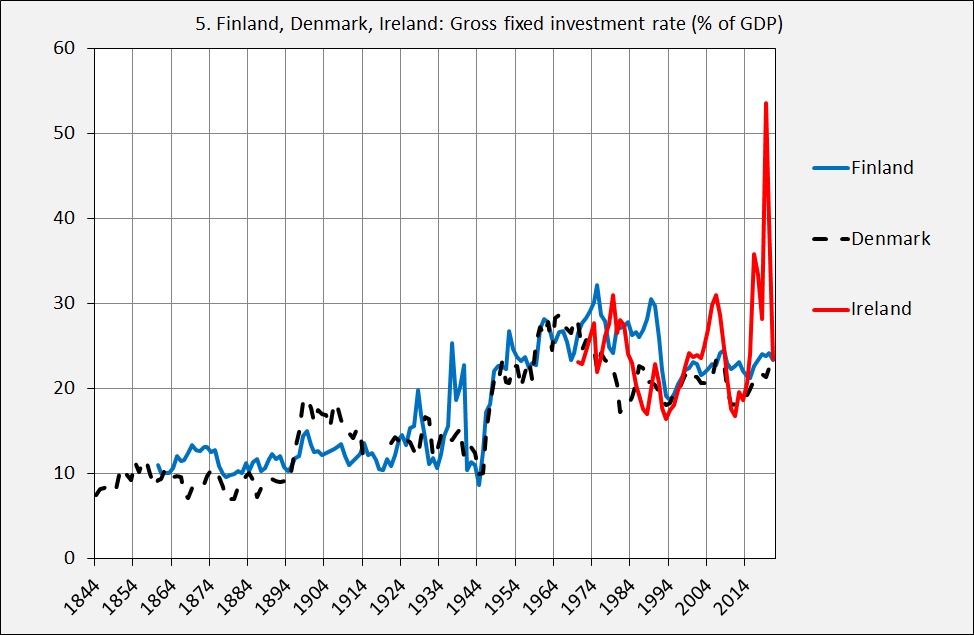
Graph 5 shows developments in Denmark, Finland and Ireland. Denmark shows the same pattern as Sweden, Germany, the Netherlands and France, Finland may have been a little late to the party – but made up with this with remarkable high rates during the twenties and thirties. The really interesting development is of course the extreme level in Ireland. Extreme: even the housing boom after 2000 led t a ratf ‘only’ 30% of GDP. A good overview by the Central Statistical Office of Ireland can be found here. What basically happened: multinationals selling their patents from one country to another. Imagine Microsoft Ireland buying patents from Microsoft USA and financing this with ‘payables’ (in this case a kind of intercompany IOU). That’s it. My opinion: such transactions do happen and are real but they should be included in the Flow of Funds and not be part of the national accounts. A case can be made that Research and Development should be counted as ‘capital formation’. But just shifting property rights and counting the value of these rights ad ‘capital formation’ distorts the concept of ‘fixed investment’ as an activity leading to an increase of the stock of capital and which leads to the use of labor, capital and land to do this (look at ‘Green Coffins‘ for an especially land intensive kind of modern fixed capital). Just shifting property rights does not lead to an increased of the stock of capital.
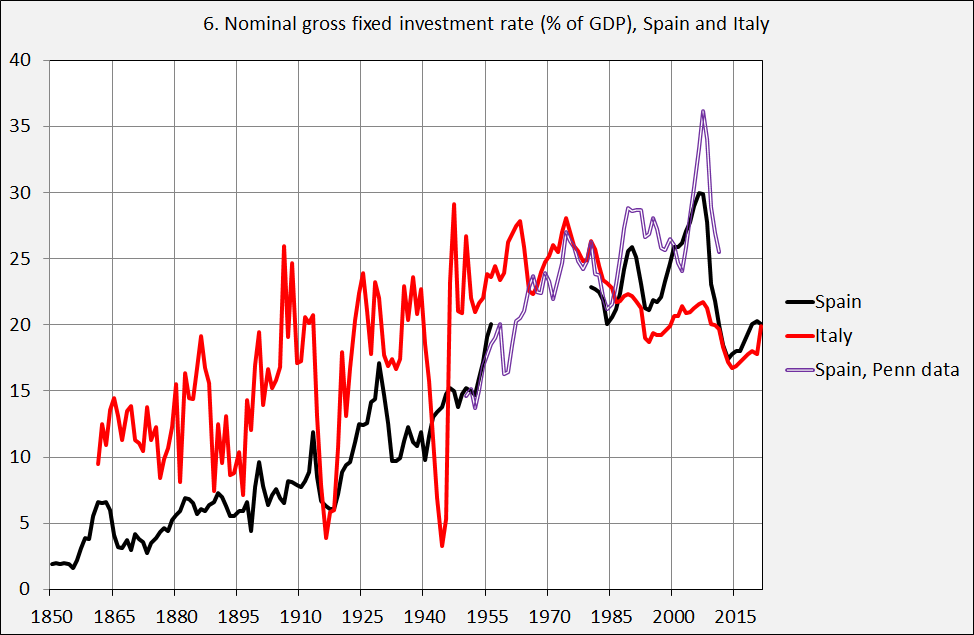
Graph 6 shows that Italy knew a relatively high investment rate already after 1860, while the Spanish rate only really increased after World War I. Remarkable. There was quite a gap in my Spanish series and I used the well known Penn data to bridge this gap. The Penn data on investments are however based on series in: “a common set of weighted average international prices (IP) in a common currency (the US dollar)” which causes quite a differences with the data in prices actually paid – the Penn data seem to be artificially high. Clearly visible is the downturn caused by the end of the construction boom associated with the introduction of the Euro – Spain is still recovering. A new Green Deal in this sunny country is essential.
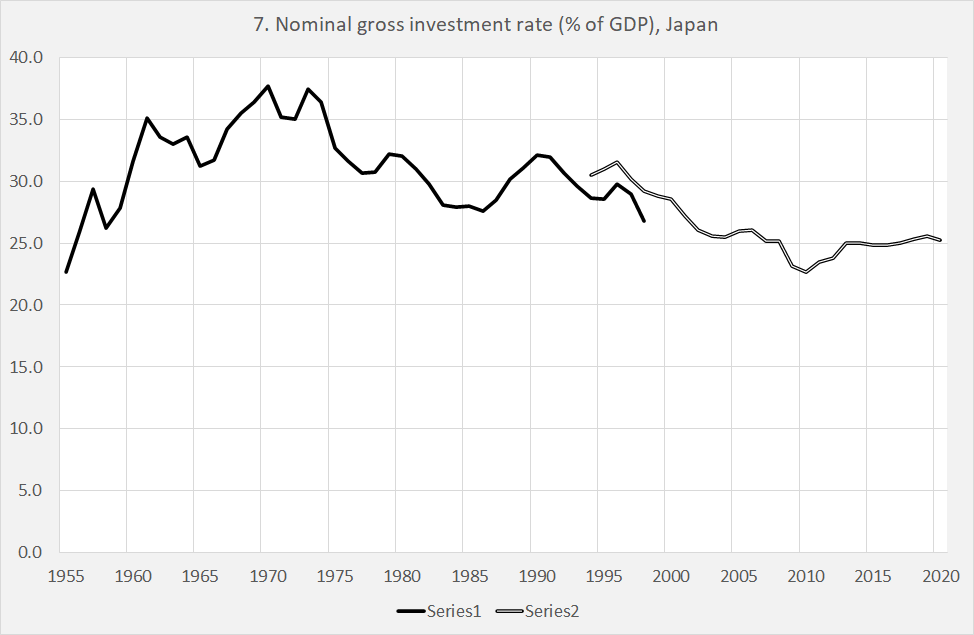
Figure 7 is an addition to the data in my book mentioned and shows the rate for Japan. The pattern is on one hand comparable with the European pattern, but the ‘bump after 1955 is higher and reaches almost 40%, which is not entirely unusual for Asian countries catching up. Japan seems to have adapted reasonably well to the decline of the rate, even if this necessitated decades of very low interest rates and high government deficits, to make up for the gap caused by the decline of the investment rate. If only Spain had been able to do this…
Summary: the rate of investment, already analyzed by Kuznets in 1955 (but not by many people after him, remarkably) offers an tantalizing glimp into the long run relation between spending and prosperity. We can, however, ask the question if the concept of gross fixed capital formation used nowadays is optimal to show this.
