From C. P. Chandrasekhar and Jayati Ghosh The dramatic increase in global oil and food prices from the start of the Ukraine War did not reflect real global supply shortages or demand-supply imbalances. Rather, it reflected the impact of market concentration and financial activity in commodity futures markets, which enabled some large private players particularly global agribusinesses and financial companies to make a killing. This is now so evident from the data that it is more widely acknowledged. The agricultural commodity that was most affected by the Ukraine war is wheat. Wheat prices in global trade surged from January to June 2022, then fell, so that by the end of 2022 they were back to around the pre-war level. But in this period, both global production and trade volumes of
Topics:
Editor considers the following as important: Uncategorized
This could be interesting, too:
tom writes The Ukraine war and Europe’s deepening march of folly
Stavros Mavroudeas writes CfP of Marxist Macroeconomic Modelling workgroup – 18th WAPE Forum, Istanbul August 6-8, 2025
Lars Pålsson Syll writes The pretence-of-knowledge syndrome
Dean Baker writes Crypto and Donald Trump’s strategic baseball card reserve
from C. P. Chandrasekhar and Jayati Ghosh
The dramatic increase in global oil and food prices from the start of the Ukraine War did not reflect real global supply shortages or demand-supply imbalances. Rather, it reflected the impact of market concentration and financial activity in commodity futures markets, which enabled some large private players particularly global agribusinesses and financial companies to make a killing. This is now so evident from the data that it is more widely acknowledged. The agricultural commodity that was most affected by the Ukraine war is wheat. Wheat prices in global trade surged from January to June 2022, then fell, so that by the end of 2022 they were back to around the pre-war level. But in this period, both global production and trade volumes of wheat increased, while demand (utilization) remained around the same. The lack of any changes in physical supply and demand in global markets points to the role of oligopolistic pricing and speculative forces in shaping wheat price movements over this period.
However, instead of highlighting the need to regulate these global markets, in many official circles in advanced economies and in international agencies, the opposite conclusion is being drawn. The short-lived nature of the price hike is now being used to argue that these changes should not really concern us very much, because the worst of the price hike lasted only a few months, before subsiding again.
This is an extremely problematic, even dangerous argument. It ignores the massive destructive impact of even temporary spikes in global food prices on the incidence of hunger among the poor population in the world, as recent FAO data make clear. But what is even worse is that these global food prices play out in peculiar and unequal ways, whereby prices in low- and middle-income countries rise when global prices do, but do not necessarily come down when the global price falls. Therefore, food inflation persists and adds pressure to household budgets across most of the world.
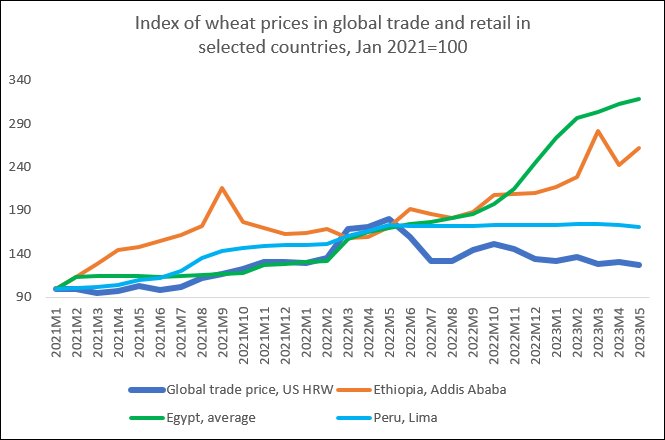
This can be considered by comparing recent trends in global wheat prices with those in a cross section of low- and middle-income countries in different parts of the world. Figure 1 provides a depiction of index numbers of wheat prices in global trade and retail prices in the wheat-importing countries of Ethiopia, Egypt and Peru. The global trade price used here is that of US Hard Red Wheat, one of the benchmark trade prices. The country price data refer to retail prices, or those experienced by consumers.
Figure 1

Sources: Calculated from
https://fpma.fao.org/giews/fpmat4/#/dashboard/tool/international (for global trade price)
https://fpma.fao.org/giews/fpmat4/#/dashboard/tool/international (for national retail prices)
As Figure 1 shows, global trade prices of wheat started rising from mid-2021, increased sharply from February 2022 as the Ukraine war got underway, and then started falling from June 2022. In fact, by July 2022 it was at around the same level as January 2022. However, in the three wheat-importing countries shown here, the wheat prices showed a very different trend. They all rose with the global price until May 2022. But thereafter, they remained high (Peru) or continued to rise even faster (Ethiopia and Egypt).
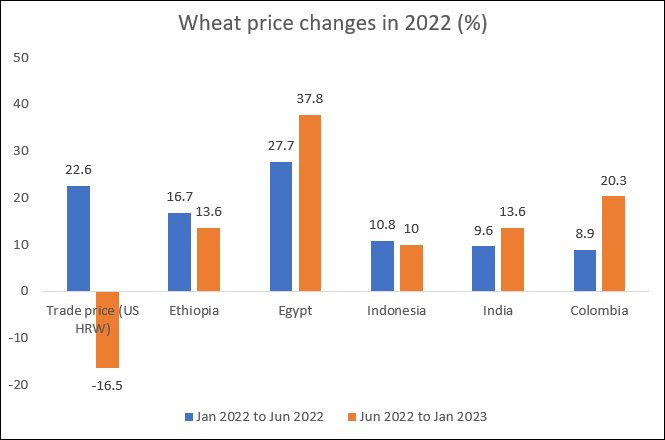
This becomes even more evident when we examine the changes over the year 2022 for these countries and for two more, Colombia and India, that are also impacted by global trade, being either wheat importers or exporters depending on changing contexts. Figure 2 shows the changes in wheat prices in global trade as well as for these five countries over two period: the rising phase of January to June 2022, and the subsequent phase of June 2022 to January 2023. The global wheat price increased by 23 per cent in the first phase, and retail prices increased by 10-28 per cent in these five countries. In the subsequent period, global trade prices fell by 17 per cent. But none of these five countries showed any decline in retail wheat price. On the contrary, they continued to increase, and in the cases of Egypt, Colombia and India, the wheat price rises actually accelerated further.
Figure 2

Sources: Calculated from
https://fpma.fao.org/giews/fpmat4/#/dashboard/tool/international
https://www.statista.com/statistics/1172542/monthly-average-prices-for-wheat-in-egypt/
Figure 3

Source: https://data.imf.org/regular.aspx?key=63140098
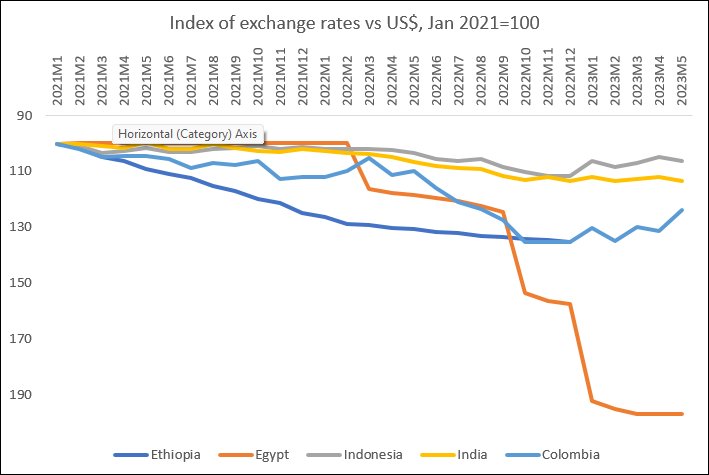
What explains this similar and disturbing pattern of continued wheat price increases across what are quite different economies? It is unlikely that distribution margins would have changed very dramatically in all of these countries, so this clear difference in price movements must be ascribed to other factors. One important common factor is highlighted in Figure 3. Remember that global commodity markets (including both oil and food) typically are denominated in US dollars. All of the countries considered here (along with most low- and middle-income countries) experienced significant depreciation vis-a-vis the US dollar over this period.
The sharper currency depreciation was typically experienced from February 2022 onwards, even though for some the process had started well before, with the tightening of monetary policies in the advanced economies. Egypt experienced the sharpest fall, followed by Ethiopia and Colombia—but even India and Indonesia experienced depreciations of around 10 per cent just over 2022. For importing countries, this automatically raises the price of imported wheat in domestic markets, and even for countries not currently importing, there are inflationary pressures generated by the combination of global price shifts and domestic currency depreciation.
The currency depreciation in turn was clearly affected by capital flows, as mobile capital sought the renewed higher returns in supposedly “safe markets” of the developed world. But it was also impacted by current account flows, which include both lower forex receipts and higher forex payments. In other words, the higher global price of essential imports like foodgrain added to the balance of payments pressure in these countries, probably contributing to the currency depreciation in foreign exchange markets. And this very depreciation in turn contributed to higher food costs in these countries.
This doom loop in such countries can be stopped, but only by proactive policies. It is clear that there has to be greater attention to domestic food sovereignty through encouraging sustainable agricultural practices that make smallholder cultivation viable and more productive. But food policies are not sufficient, since exchange rate movements are adding to the problem. In addition, measures to arrest forex outflows, particularly through capital account management strategies, are now essential not just to avert possible financial crises, but even to ensure food security for vulnerable populations.
(This article was originally published in the Business Line on August 21, 2023)
