Producer prices in the UK are declining. Does this mean inflation is over? Hmmm… Many economists have difficulties understanding the present aftermath of an inflationary episode (which might be followed by new episodes…). Which is, considering their theoretical framework, understandable. They look at only one set of prices: consumer prices (or, in the case of derivatives ‘core prices’ and many others‘, even only at a subset of this set). Instead, they should expand their frame of reference and look at more sets of prices and, consistent with economic theory, at the relations between these sets. We do have the data. Here, you will the ‘inflation dashboard’ of the Dutch CBS, which is not just based on consumer prices but also on wages, interest rates (‘translation not available’).
Topics:
Merijn T. Knibbe considers the following as important: Uncategorized
This could be interesting, too:
tom writes The Ukraine war and Europe’s deepening march of folly
Stavros Mavroudeas writes CfP of Marxist Macroeconomic Modelling workgroup – 18th WAPE Forum, Istanbul August 6-8, 2025
Lars Pålsson Syll writes The pretence-of-knowledge syndrome
Dean Baker writes Crypto and Donald Trump’s strategic baseball card reserve
Producer prices in the UK are declining. Does this mean inflation is over? Hmmm… Many economists have difficulties understanding the present aftermath of an inflationary episode (which might be followed by new episodes…). Which is, considering their theoretical framework, understandable. They look at only one set of prices: consumer prices (or, in the case of derivatives ‘core prices’ and many others‘, even only at a subset of this set). Instead, they should expand their frame of reference and look at more sets of prices and, consistent with economic theory, at the relations between these sets.
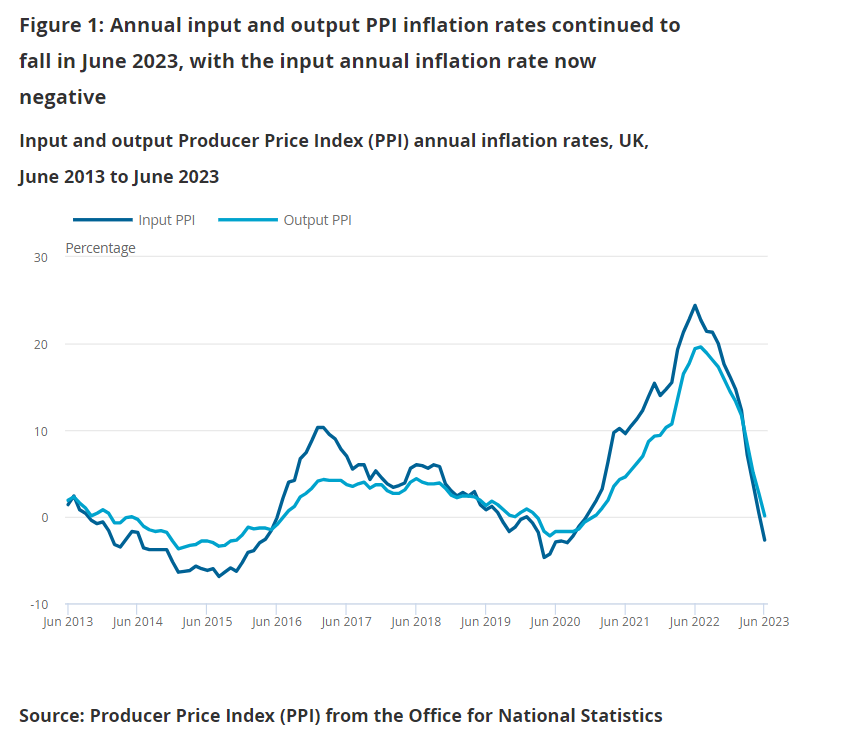
We do have the data. Here, you will the ‘inflation dashboard’ of the Dutch CBS, which is not just based on consumer prices but also on wages, interest rates (‘translation not available’). Here, UK producer prices of the UK ONS (declining down, by the way). Here, The Bank of Japan interest rates. Here you can find, within the theoretical framework used to compile the National Accounts, price (and volume) indexes of Indian public expenditure, agricultural production, manufacturing and much more.
We do have the economic theory. Above, the national accounts were mentioned. These do provide a carefully and consistently estimated per sector (consumers, government, banks, business, NGO’s) and per subsector (agriculture, mining, and quarrying etcetera) overview of (funding of) total spending, production, and income as well as relations between these subsectors, input output tables can be used to put these relations into a dynamic perspective. The CBS dashboard mentioned above is (loosely) based on these distinctions. The ONS producer prices are carefully based on the national accounts subsectors. Interest rates are tied to the subsector ‘banks’(which is modeled as the central bank plus a number of subsidiaries, i.e. more or less as 1 company). Also, part of public expenditure is, and rightly so but at odds with neoclassical macro economics, added to household consumption (education and the like) – meaning that in a rational expectations framework the price of this part of public expenditure should be added to the CPI!
What’s holding us back? Well, nothing. Isabelle Weber and others are using such data and the aforementioned theory and methods. The economists of for instance the ECB are acutely aware of the importance of interrelations and looking beyond consumer prices (graph), as well as of the drawbacks of using the consumer price index as the one and only true gauge of inflation and they truly try to understand inflation looking at more prices and relations between sectors.
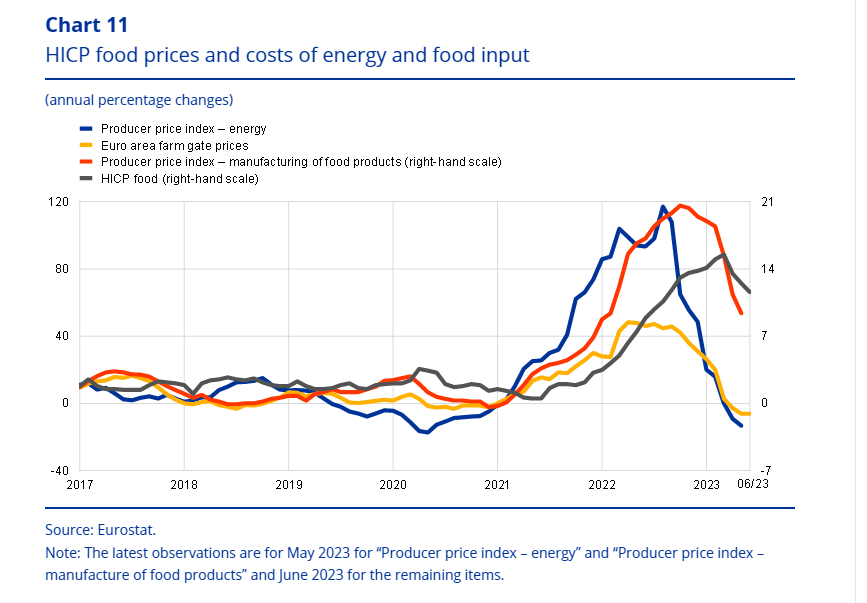
Despite this, the ECB still uses consumer prices as their official target (even when they have a very, very hard time influencing these). Why? To an extent: institutional conservatism. To another extent: outdated sillynomics based on neoclassical macro. But there is more. The implication of looking at not just on set of prices and at relations between economic sectors is that we have to move beyond prices and should start to look at flows of expenditure and income between sectors. The graph above shows that, at this moment, retail food price inflation is quite a bit higher than energy price inflation, farm gate food prices and prices of manufacturing food. Hmmm…
Producer prices in the UK are declining. This does not mean that inflation is over. Understanding inflation requires understanding the relation between producers and retailers and consumers. At this moment, it seems that inflation is increasingly concentrating on the consumer market, leaving retailers with higher margins. One year ago, owners and users of land and owners natural resources were winners. This seems to have changed. Understanding inflation means that we have to be on the lookout for such changes, even when, as the CBS dashboard mentioned above shows, more and more sectors and kinds of prices (with the notable exception of interest rates) show lower price increases.