From Blair Fix In my last post, I looked at the relation between economic growth and inflation. As per usual, the evidence didn’t sit well with mainstream economics. According to standard theory, there is a trade off between low inflation and high economic growth. The idea is that you can have one or the other, but not both. So if you want to keep inflation low, you have to ‘cool off’ the economy by slowing economic growth. (Like many things in economics, this idea comes from the totem of supply and demand.) The trouble is, the empirical evidence shows that the opposite is true. Rather than being driven by ‘excessive’ economic growth, inflation tends to come during periods of stagnation. So despite what mainstream economists proclaim, there is little evidence for a ‘growth-inflation
Topics:
Editor considers the following as important: Uncategorized
This could be interesting, too:
tom writes The Ukraine war and Europe’s deepening march of folly
Stavros Mavroudeas writes CfP of Marxist Macroeconomic Modelling workgroup – 18th WAPE Forum, Istanbul August 6-8, 2025
Lars Pålsson Syll writes The pretence-of-knowledge syndrome
Dean Baker writes Crypto and Donald Trump’s strategic baseball card reserve
from Blair Fix
In my last post, I looked at the relation between economic growth and inflation. As per usual, the evidence didn’t sit well with mainstream economics.
According to standard theory, there is a trade off between low inflation and high economic growth. The idea is that you can have one or the other, but not both. So if you want to keep inflation low, you have to ‘cool off’ the economy by slowing economic growth. (Like many things in economics, this idea comes from the totem of supply and demand.)
The trouble is, the empirical evidence shows that the opposite is true. Rather than being driven by ‘excessive’ economic growth, inflation tends to come during periods of stagnation. So despite what mainstream economists proclaim, there is little evidence for a ‘growth-inflation trade off’. Instead, ‘stagflation’ seems to be the norm.
Now, the question is why?
Soon after I published ‘Is Stagflation the Norm?’ several readers pointed out that I should take a look at causation. The idea is that we want to know what drives what. Does (low) inflation drive (high) economic growth? Or does (low) economic growth drive (high) inflation?
Well, I’ve done the math, and the results may surprise you. But before we get there, let’s take a look at what the theory of capital as power has to say about the causes of inflation.
Stagflation as sabotage
Created by political economists Jonathan Nitzan and Shimshon Bichler, the theory of capital as power is decidedly non-mainstream. (It’s about as far from neoclassical economics as you can get.) Whereas mainstream economists look at capitalist society and see ‘productivity’ everywhere, Nitzan and Bichler see business ‘sabotage’.
It’s an idea that at first seems incendiary. But once you think about the behavior of real-world corporations, the notion of business sabotage seems on point. Everywhere we look, we find big corporations behaving badly.
Sci-fi writer Cory Doctorow calls this behavior ‘enshittification’. Looking at social media companies, he notes that what people want from their social-media apps is simple. People want to connect with their friends. And they want a feed that shows them what their friends are up to. That’s it.
The problem is that this simple desire is at odds with making a profit. You see, to make a profit, social media companies need to slam sponsored content down your throat — i.e. fill your feed with ads and clickbait. Because that’s the opposite of what people want, Doctorow notes that social-media apps follow a predictable trend. First, they lure people onto the platform by giving them what they want (a feed filled with their friends’ content). Then, once enough people are locked in, the company flips the money switch and enshittifies its platform with paid junk.
What’s this enshittification got to do with inflation? Everything!
Take Twitter as an example. After Elon Musk bought Twitter, he moved frantically to cut costs and raise prices. Almost immediately, Musk turned on the inflation dial by charging for blue checkmarks.1 Prior to this move, blue checkmarks had been Twitter’s way of authenticating ‘accounts of public interest’. Sure, the authentication was somewhat arbitrary … but at least it was free.
Today, the same blue checkmark will cost you $8 a month. And it’s no longer a marker solely of prestige. No, the blue checkmark is now a pay-to-play system that gives you “priority ranking in search, mentions and replies”. In other words, if you want your followers to see your content (something you previously got for free), you’ve got to hand Mr. Musk $8 a month. That’s business sabotage, plain and simple. It’s inflation through enforced scarcity.
The ‘enforced’ part is key. Yes, we live in a world in which resources are finite, and hence ‘scarce’. But regardless of a resources’ innate abundance, maintaining high prices requires restriction.
Diamonds are a good example. Sure, they are rare. But as my colleague D.T. Cochrane observed in his seminal PhD thesis, diamonds are not rare enough to suit the diamond business. That’s why De Beers (a diamond cartel) spent years buying up diamonds to purposefully keep them off the market. Like all savvy businesses, De Beers knew that enforced scarcity (aka sabotage) was the key to high prices.
Looking at capitalist society, Nitzan and Bichler argue that this enforced scarcity tends to come in waves, largely because it is unstable. For instance, if I bolster prices by restricting access to my property, the risk is that my competitor will undercut me. Conversely, if I undercut my competitor, the risk is that they will respond by cutting there prices in turn, resulting in a price-race to the bottom.
Neoclassical economists look at these dynamics and conclude that they will lead to market equilibrium. But that’s because economists suppose that businesses won’t coordinate. In the real world, though, businesses coordinate all the time. It’s called herd behavior. If everyone else is cutting prices and selling more stuff, I’d better do the same. And if the herd decides to restrict supply and hike prices, I’d best join in. The result will be an oscillation between periods of economic boom with low inflation, and periods of economic bust with high inflation.
As it turns out, this is exactly what happens in the real world. Across countries, economic growth (as measured by energy consumption) tends to be high when inflation is low (and vice versa). That was the key result in ‘Is Stagflation the Norm?’ But this pattern raises a question: what causes what? Does high inflation cause low economic growth? Or does low economic growth cause high inflation?
If the sabotage thesis is correct, then the latter should be true. Purposeful restriction (by business) should lead to higher prices.
A cause must precede its effect
In the social sciences, establishing causation is difficult, especially for large-scale behaviors. The problem is simple: we can’t run experiments that isolate the variable we want to study. So we’re left looking at history, trying to make educated guesses about cause and effect.
Fortunately, there are some tricks to help us out. While causation is difficult to establish, it is easier to rule out. That’s because if a hypothesized ‘cause’ comes after the hypothesized ‘effect’, the hypothesis is wrong.
With this principle in mind, one way to test for causation (or to be more precise, eliminate non-causation) is to take time-series data and introduce leads and/or lags. So instead of correlating data observed in the same year, we correlate data in adjacent years.
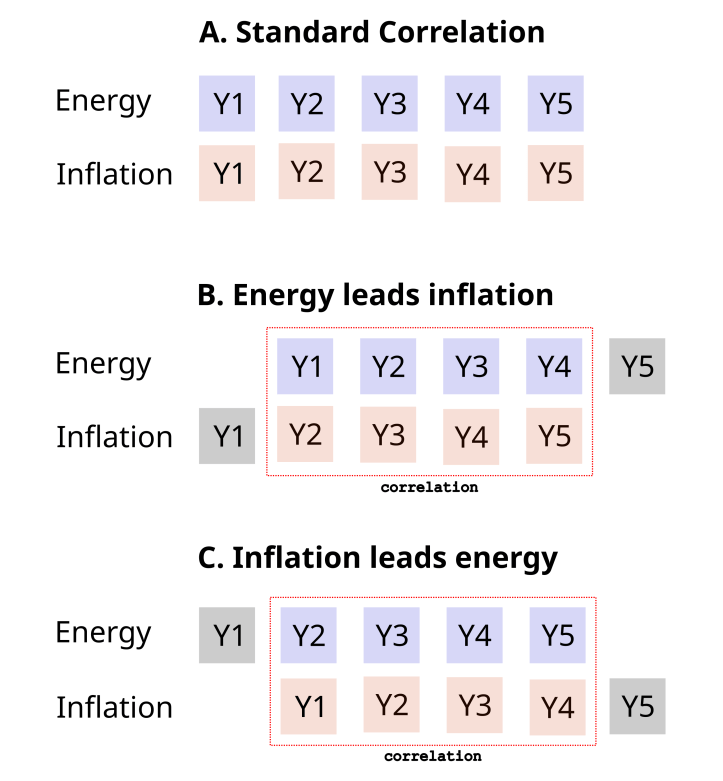
Figure 1 illustrates the principle using the energy-inflation data that I’ll work with. In example A, we have standard correlation. We take time series for energy use and inflation and match the observation years (Y1, Y2, etc.). Then we see if the data is correlated. On its own, this correlation tells us little about causation. However, we can get more clues by leading/lagging the data.
In example B, we let energy lead inflation. Visually, we slide the inflation data to the left. The result is that energy data in year one (Y1) now lines up with inflation data in year two (Y2), and so on. If we find a correlation, it means that changes in energy use precede the corresponding change in inflation. In other words, energy variation is a plausible cause of inflation. Next, we do the opposite. In example C, we let inflation lead energy. Now we’re testing the reverse causation — that changes in inflation cause changes in energy use.
Of course, the lead-lag method isn’t guaranteed to give insight into causation. For example, we might find that the correlation in scenario B is identical to the correlation in scenario C. If that happens, we’re back to square one, with no idea about what causes what.
The hope, though, is that one of the lead-lag scenarios trumps the other. In that case, the scenario with the higher correlation indicates the more plausible direction of causation.
Does high inflation precede low growth?
With our lead-lag method in hand, lets return to the energy-inflation data. To review, the data comes from the World Bank and contains energy-inflation time series for a wide sample of countries, starting in 1960.
(Inflation is measured in terms of the change in the consumer price index. I use the growth rate of energy consumption per capita as a measure of economic growth. Sidenote: if you follow this blog, you’ll know that I dislike the standard measure of growth, ‘real’ GDP.)
In ‘Is Stagflation the Norm?’ I showed that energy growth rates tend to correlate negatively with inflation. Let’s now see if we can tease out the direction of causation.
I’ll start by testing if high inflation precedes low growth. Figure 2 shows the pattern across countries. Here’s how the analysis works. I begin by taking annual inflation rates for all countries and putting them into different size bins. Each blue point shows the midpoint of the bin, with the corresponding inflation rate plotted on the horizontal axis. On the vertical axis, I take the countries in each inflation bin and plot their energy-per-capita growth rates in the following year. The blue line indicates the median growth rate. The shaded region shows the middle 50% of data.
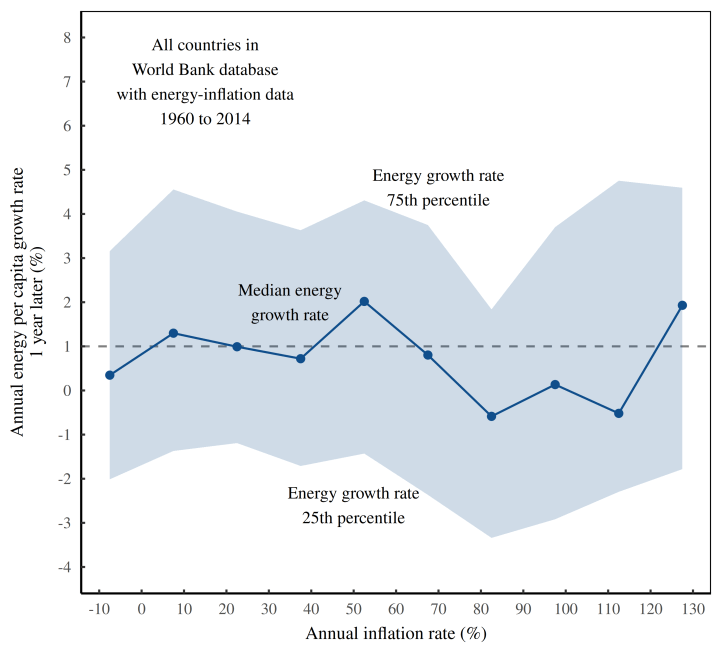
Looking at the pattern in Figure 2, it’s hard to see any trend. In other words, inflation rates are not good at predicting energy growth rates in the following year.
When we turn to the trend within countries, we find something similar. Figure 3 shows the data. Here’s how the analysis works. I start by taking each country and calculating the correlation between the rate of inflation and the energy-per-capita growth rate in the following year. The histogram then shows the distribution of within-country correlations.
Again, we find no consistent pattern. Across this sample of countries, about half have a positive lagged correlation, and half have a negative correlation. That’s the definition of inconclusive.
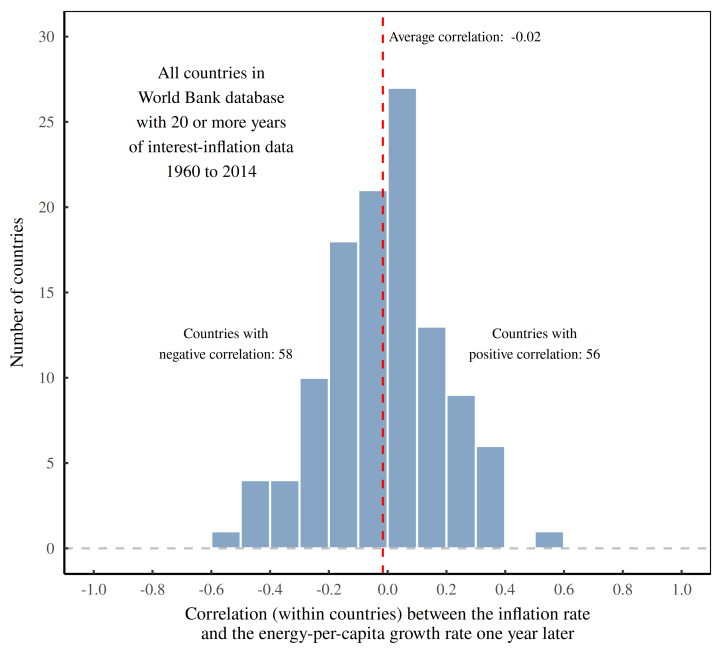
To summarize, there’s no convincing evidence that changes in inflation precedes changes in energy growth. So the data suggests that it’s not inflation that drives economic stagnation.
Does low growth precede high inflation?
Let’s now test the reverse hypothesis — that low energy growth precedes high inflation. My steps are the same as before, but this time I reverse the lead-lag. I let the energy data lead the inflation data.
Now we get results that are more compelling.
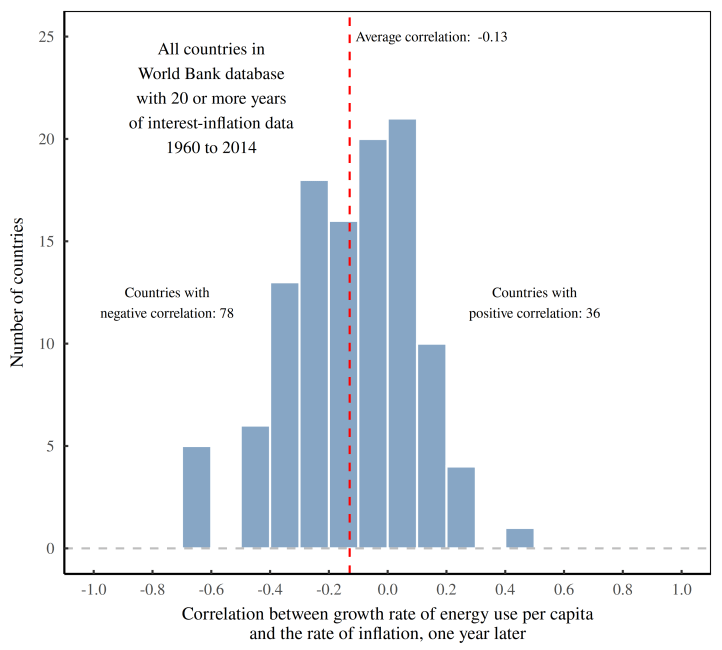
Figure 4 shows the pattern across countries. Here, the vertical axis shows binned values for the (national) growth rate of energy use per capita. The vertical axis plots the inflation rate (within each bin) in the following year. The resulting trend is easy to see. As energy growth rates increase, next-year’s inflation rates tend to decline. There’s also a significant decline in the volatility of next-year’s inflation.
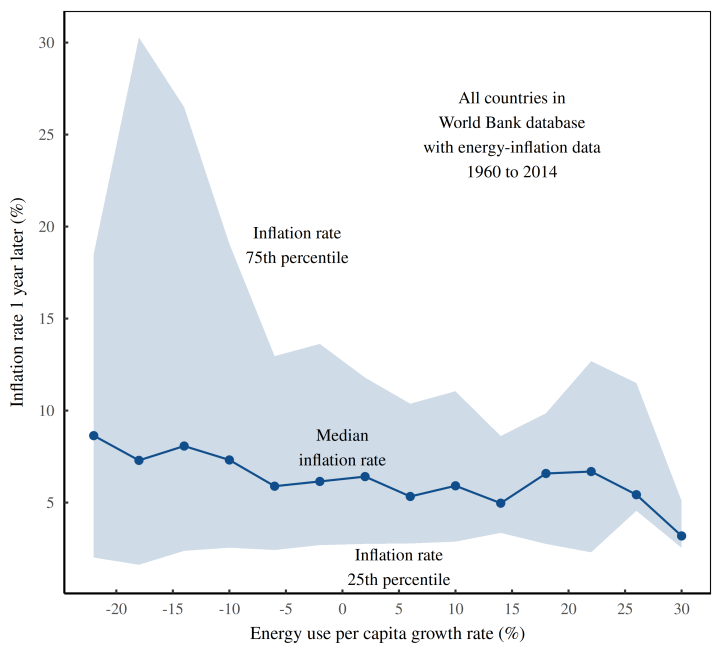
Looking at the trend within countries, we find the same pattern. Lower energy-per-capita growth rates are associated with higher rates of inflation in the following year. Figure 5 runs the numbers.
Here, I start by taking each country and calculating the correlation between the energy-use-per-capita growth rate and the rate of inflation in the following year. The histogram then shows the distribution of within-country correlations. For about 68% of the countries observed here, the correlation is negative. In other words, low energy growth rates are a decent predictor of high inflation rates in the following year.
Sabotage confirmed?
Looking at the results in Figures 2–5, the evidence is fairly conclusive. Energy growth rates are a decent predictor of next-year’s inflation rates. But the reverse is not true.
So that’s sabotage confirmed, right? Businesses are restricting the flow of resources to bolster prices!
Well, no. The scientific thing to say is that the evidence is consist with the sabotage hypothesis — namely that price gouging is preceded by a period of energy restriction. What’s causing this restriction, though, is still unknown.
For their part, mainstream economists will be happy to look at energy restriction and identify ‘exogenous shocks’ to the market. But by ‘exogenous’, economists really mean a cause that they don’t care to think about.
War is a good example. For mainstream economists, war is simply not part of their theory. But for Nitzan and Bichler, war is the most extreme form of sabotage, frequently associated with price gouging and profiteering. In particular, the (differential) profitability of oil companies seems to be tightly related to war in the Middle East.
On that front, it’s worth concluding with some history. If you lived through the 1970s, you’ll remember it as a period of rampant inflation. But do you recall the chain of events that led up to the crisis?
Here’s what happened.
In October 1973, Egypt and Syria attacked Israeli-occupied territory in the Sinai Peninsula and the Golan Heights. The United State rushed to back Israel, while the Soviet union rushed to back its Arab allies. As retribution, in December 1973, the Arab-dominated OPEC cartel announced an oil embargo against the United States. Oil prices skyrocketed. Generalized inflation soon followed.
Now we can quibble about the details, but the point is that nothing in this story fits the standard theory of inflation. There was no growth-inflation trade off. Instead, there was war, followed by an embargo imposed by a business cartel, followed by energy shortages (in the United States), followed by rampant inflation. That pretty much fits the sabotage thesis advanced by Nitzan and Bichler.
Interestingly, the wider evidence that I’ve reviewed here suggests that the last two steps of this causal chain are quite general — energy restriction precedes inflation. The harder part is to then determine what drives short-term energy restriction.
As is the norm, empirical evidence answers some questions, but leads to others. I’m fine with that because it’s better than the alternative (namely, to stop asking questions and take Econ rituals as received wisdom).
